Food with Nutrition Similar to Salt
Similar to Salt
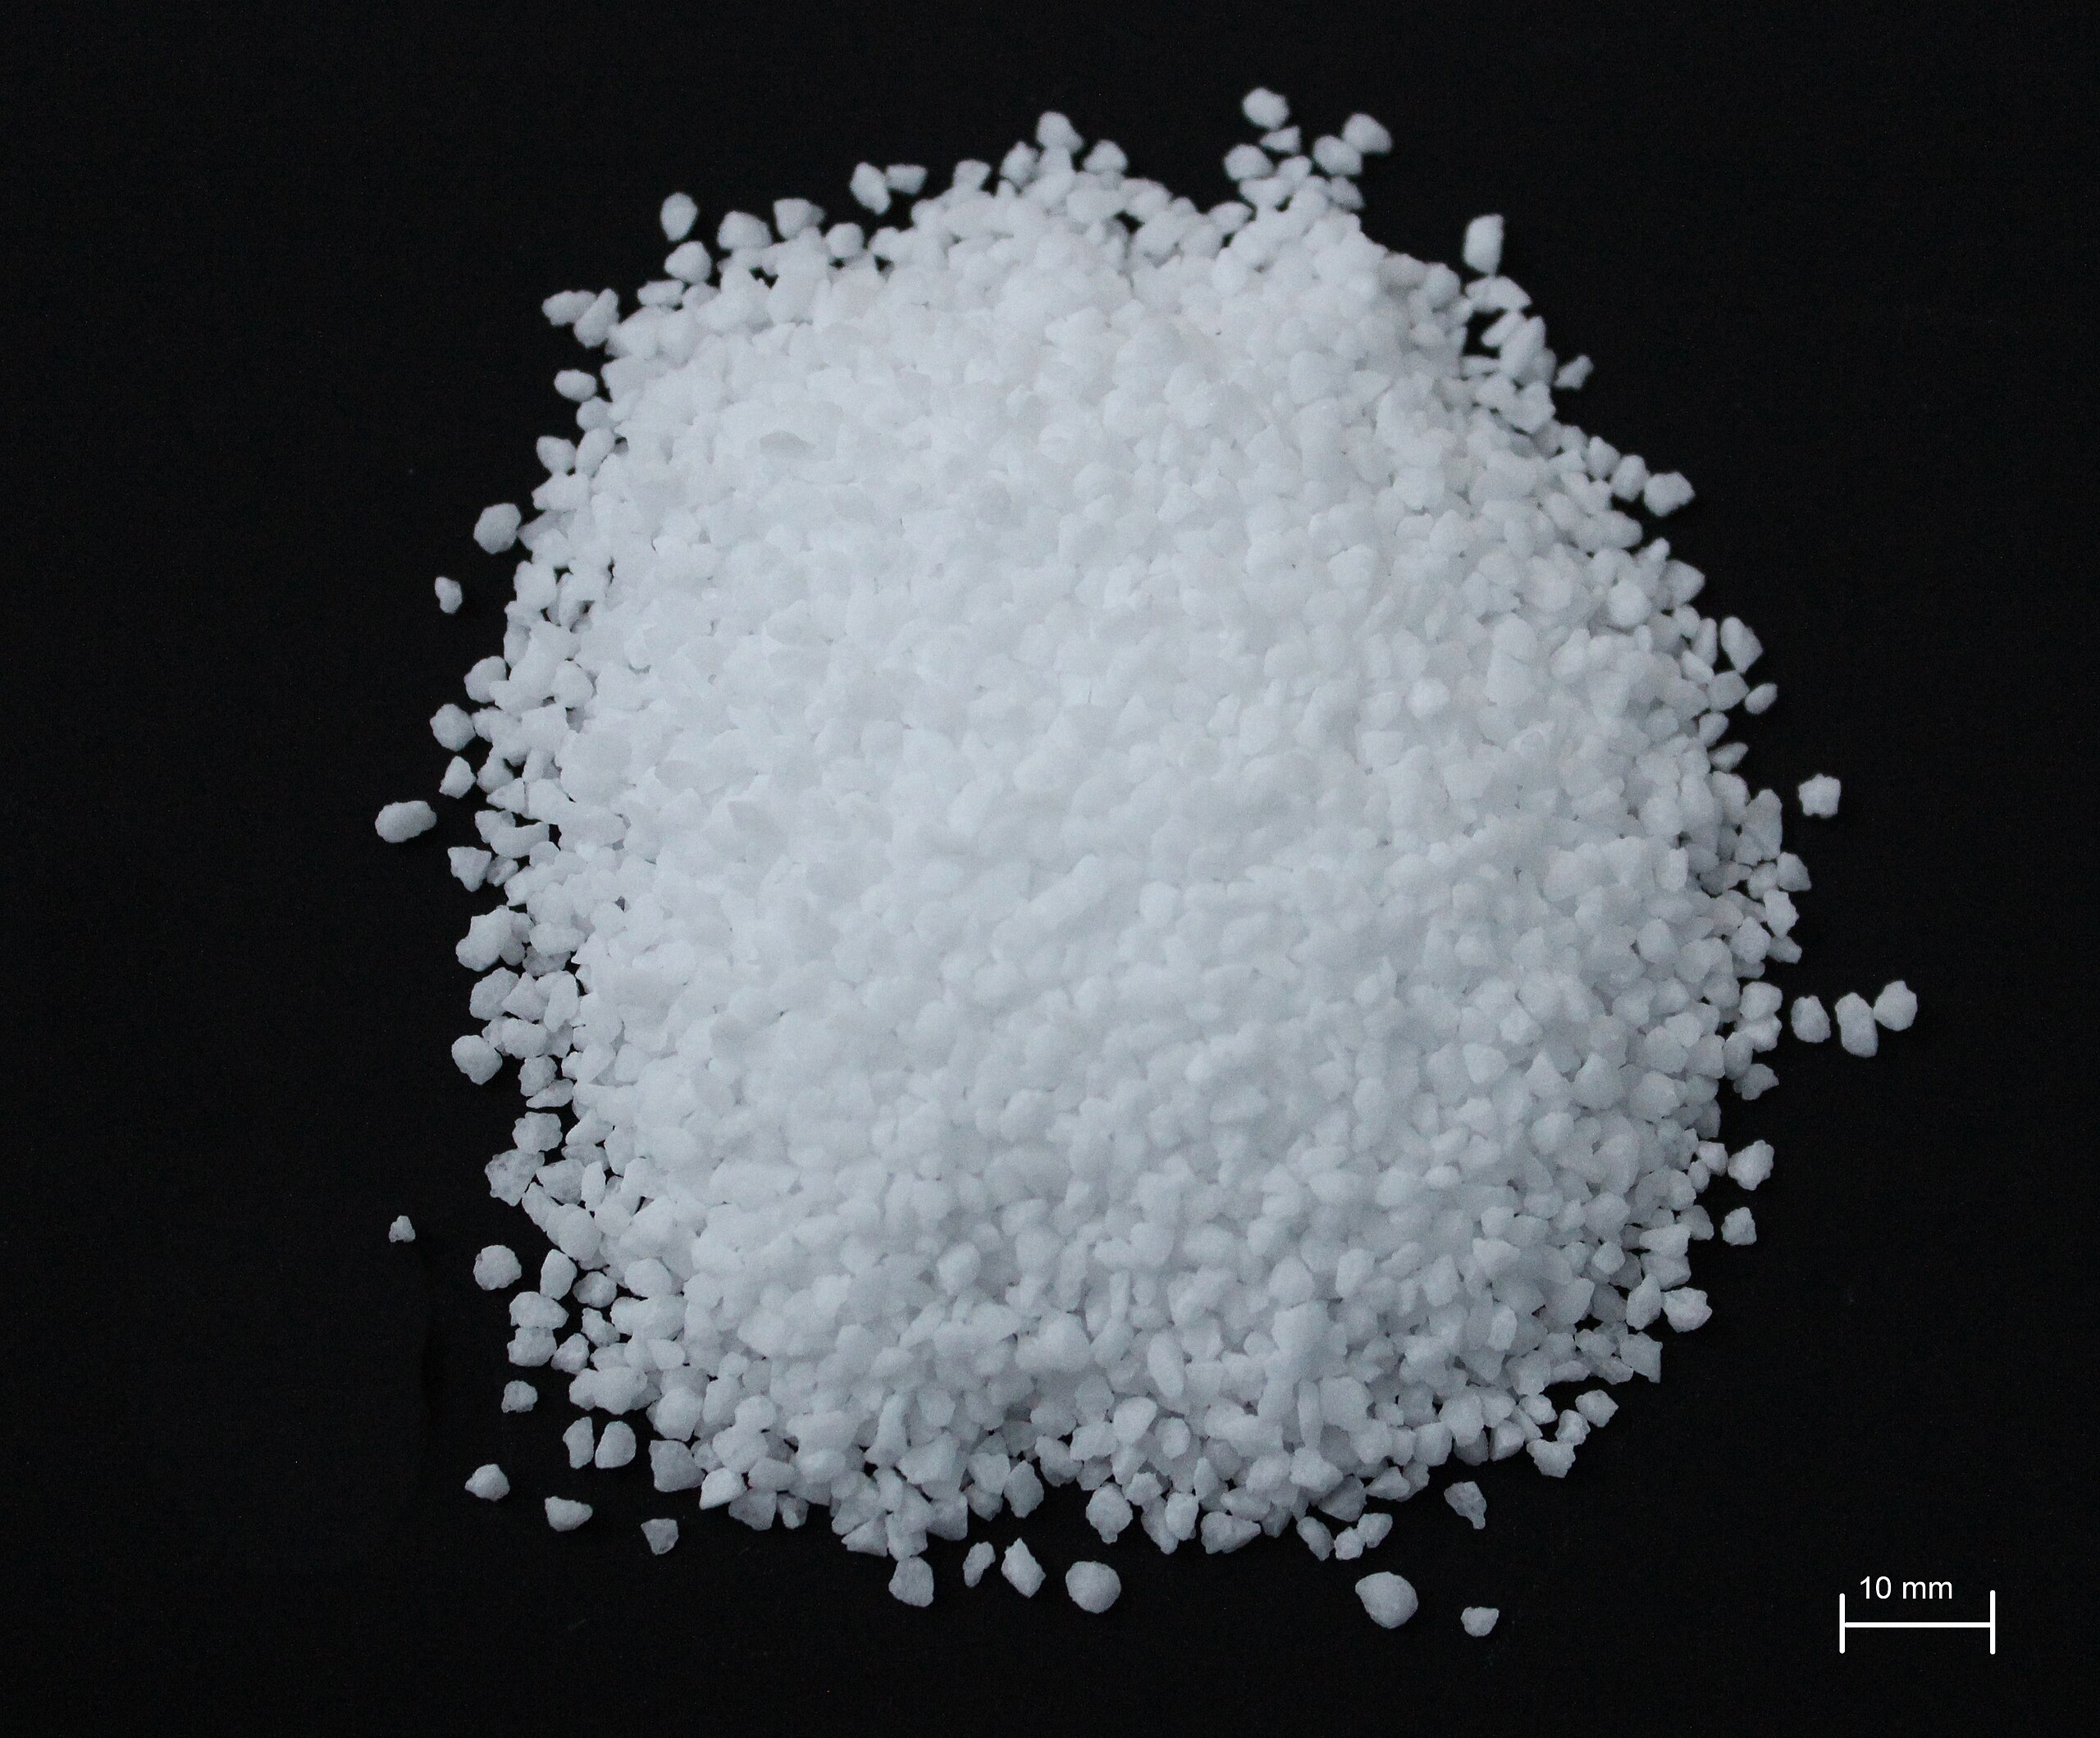
A very popular seasoning, one teaspoon of salt contains zero calories and zero grams of protein.Tumeric is similar to salt nutritionally. Other similar foods include cardamom, cinnamon and ginger.
We compared the nutritional profile of salt to hundreds of other foods with data from USDA.[1]
plants and vegetables
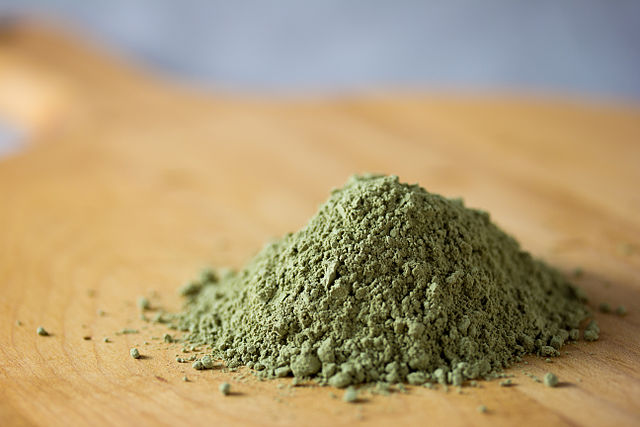
Several plants and vegetables offer similar nutrients to salt including tumeric, cardamom, cinnamon, ginger and black pepper.Tumeric

Similarity: > 90%
More nutritionally dense than salt, tumeric contains nutrients similar to salt, but in smaller amounts overall. Also, tumeric contains more dietary fiber and protein than salt.
For 100 grams of salt and tumeric:
|
Salt (17 tsps) |
Tumeric (33 tsps) |
|---|
Tumeric vs. Salt
Cardamom

Similarity: 89%
More nutritionally dense than salt, cardamom contains nutrients similar to salt, but in smaller amounts overall. Also, cardamom contains more dietary fiber, protein and Vitamin C than salt.
For 100 grams of salt and cardamom:
|
Salt (17 tsps) |
Cardamom (50 tsps) |
|---|
Cardamom vs. Salt
Cinnamon

Similarity: 89%
More nutritionally dense than salt, cinnamon contains nutrients similar to salt, but in smaller amounts overall. Also, cinnamon contains more dietary fiber and protein than salt.
For 100 grams of salt and cinnamon:
|
Salt (17 tsps) |
Cinnamon (38 tsps) |
|---|
Cinnamon vs. Salt
Ginger

Similarity: 88%
More nutritionally dense than salt, ginger contains nutrients similar to salt, but in smaller amounts overall. Also, ginger contains more dietary fiber and protein than salt.
For 100 grams of salt and ginger:
|
Salt (17 tsps) |
Ginger (56 tsps) |
|---|
Ginger vs. Salt
Black Pepper

Similarity: 87%
More nutritionally dense than salt, black pepper contains nutrients similar to salt, but in smaller amounts overall. Also, black pepper contains more dietary fiber, protein and Vitamin A than salt.
For 100 grams of salt and black pepper:
|
Salt (17 tsps) |
Black Pepper (43 tsps) |
|---|
Black Pepper vs. Salt
Tea Powder
Similarity: 86%
More nutritionally dense than salt, tea powder contains nutrients similar to salt, but in smaller amounts overall. Also, tea powder contains more dietary fiber, protein and calcium than salt.
For 100 grams of salt and tea powder:
|
Salt (17 tsps) |
Tea Powder (143 servings) |
|---|
Tea Powder vs. Salt
Nutmeg

Similarity: 75%
More nutritionally dense than salt, nutmeg contains nutrients similar to salt, but in smaller amounts overall. Also, nutmeg contains more dietary fiber and protein than salt.
For 100 grams of salt and nutmeg:
|
Salt (17 tsps) |
Nutmeg (45 tsps) |
|---|
Nutmeg vs. Salt
nuts, grains and legumes
There are quite a few seeds or grains that offer similar nutritional benefits to salt. Pine nut, wheat germ, oats, tofu and hazelnut are all high in .Pine Nut

Similarity: 85%
More nutritionally dense than salt, pine nut contains nutrients similar to salt, but in smaller amounts overall. Also, pine nut contains more dietary fiber and protein than salt.
For 100 grams of salt and pine nut:
|
Salt (17 tsps) |
Pine Nut (3/4 cup) |
|---|
Pine Nut vs. Salt
Wheat Germ

Similarity: 84%
More nutritionally dense than salt, wheat germ contains nutrients similar to salt, but in smaller amounts overall. Also, wheat germ contains more dietary fiber, protein and calcium than salt.
For 100 grams of salt and wheat germ:
|
Salt (17 tsps) |
Wheat Germ (7/8 cup) |
|---|
Wheat Germ vs. Salt
Oats

Similarity: 83%
More nutritionally dense than salt, oats contain nutrients similar to salt, but in smaller amounts overall. Also, oats contains more dietary fiber, protein and calcium than salt.
For 100 grams of salt and oats:
|
Salt (17 tsps) |
Oats (5/8 cup) |
|---|
Oats vs. Salt
Tofu

Similarity: 81%
More nutritionally dense than salt, tofu contains nutrients similar to salt, but in smaller amounts overall. Also, tofu contains more dietary fiber, protein and calcium than salt.
For 100 grams of salt and tofu:
|
Salt (17 tsps) |
Tofu (3/8 cup) |
|---|
Tofu vs. Salt
Hazelnut

Similarity: 80%
More nutritionally dense than salt, hazelnut contains nutrients similar to salt, but in smaller amounts overall. Also, hazelnut contains more dietary fiber and protein than salt.
For 100 grams of salt and hazelnut:
|
Salt (17 tsps) |
Hazelnut (3.5 ounces) |
|---|
Hazelnut vs. Salt
Pecan
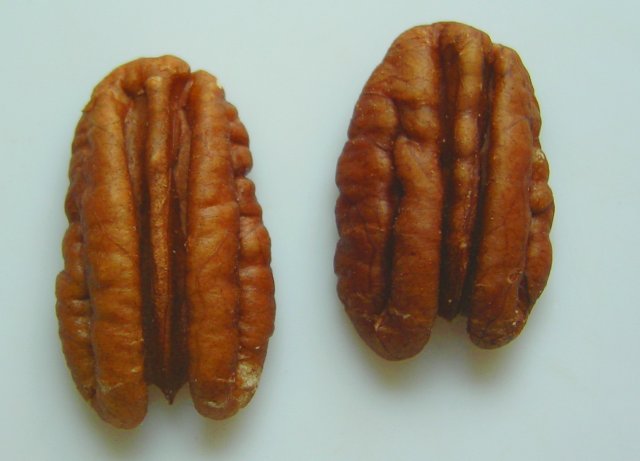
Similarity: 79%
More nutritionally dense than salt, pecan contains nutrients similar to salt, but in smaller amounts overall. Also, pecan contains more dietary fiber and protein than salt.
For 100 grams of salt and pecan:
|
Salt (17 tsps) |
Pecan (7/8 cup) |
|---|
Pecan vs. Salt
Granola

Similarity: 77%
More nutritionally dense than salt, granola contains nutrients similar to salt, but in smaller amounts overall. Also, granola contains more dietary fiber and protein than salt.
For 100 grams of salt and granola:
|
Salt (17 tsps) |
Granola (7/8 cup) |
|---|
Granola vs. Salt
Green Tea

Similarity: 77%
Green tea contains nutrients similar to salt, but in smaller amounts overall. Also, green tea contains more potassium and riboflavin than salt.
For 100 grams of salt and green tea:
|
Salt (17 tsps) |
Green Tea (3/8 cup) |
|---|
Green Tea vs. Salt
Fried Tofu
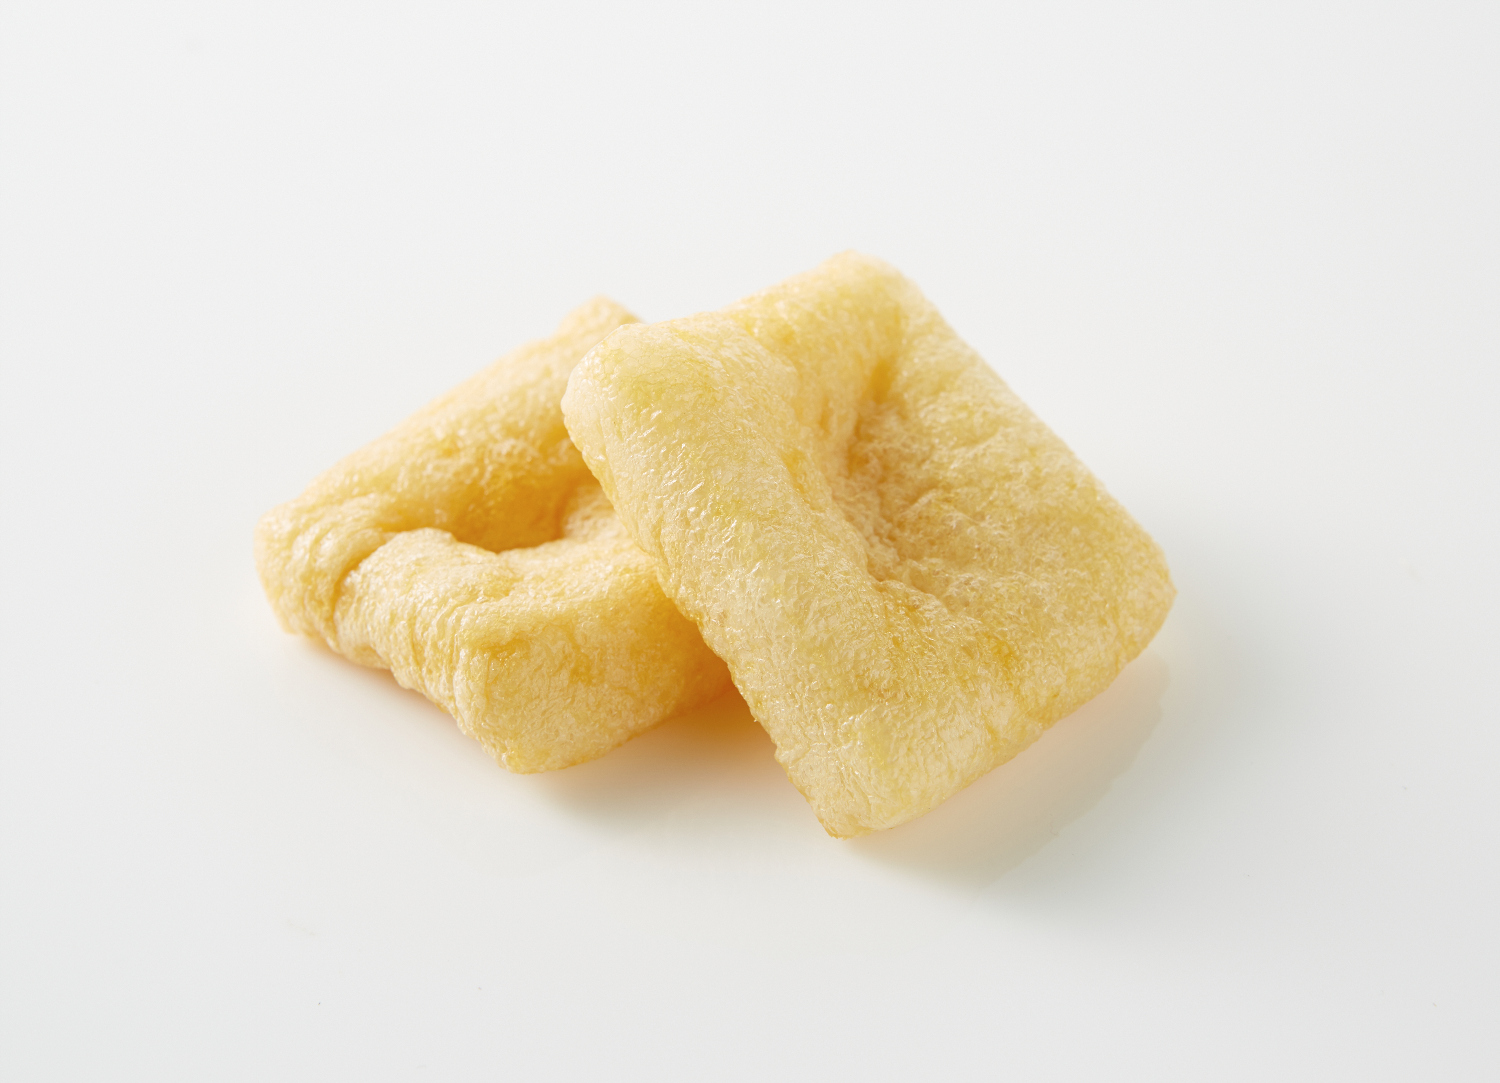
Similarity: 75%
More nutritionally dense than salt, fried tofu contains nutrients similar to salt, but in smaller amounts overall. Also, fried tofu contains more dietary fiber and protein than salt.
For 100 grams of salt and fried tofu:
|
Salt (17 tsps) |
Fried Tofu (3.5 ounces) |
|---|
Fried Tofu vs. Salt
Brown Rice
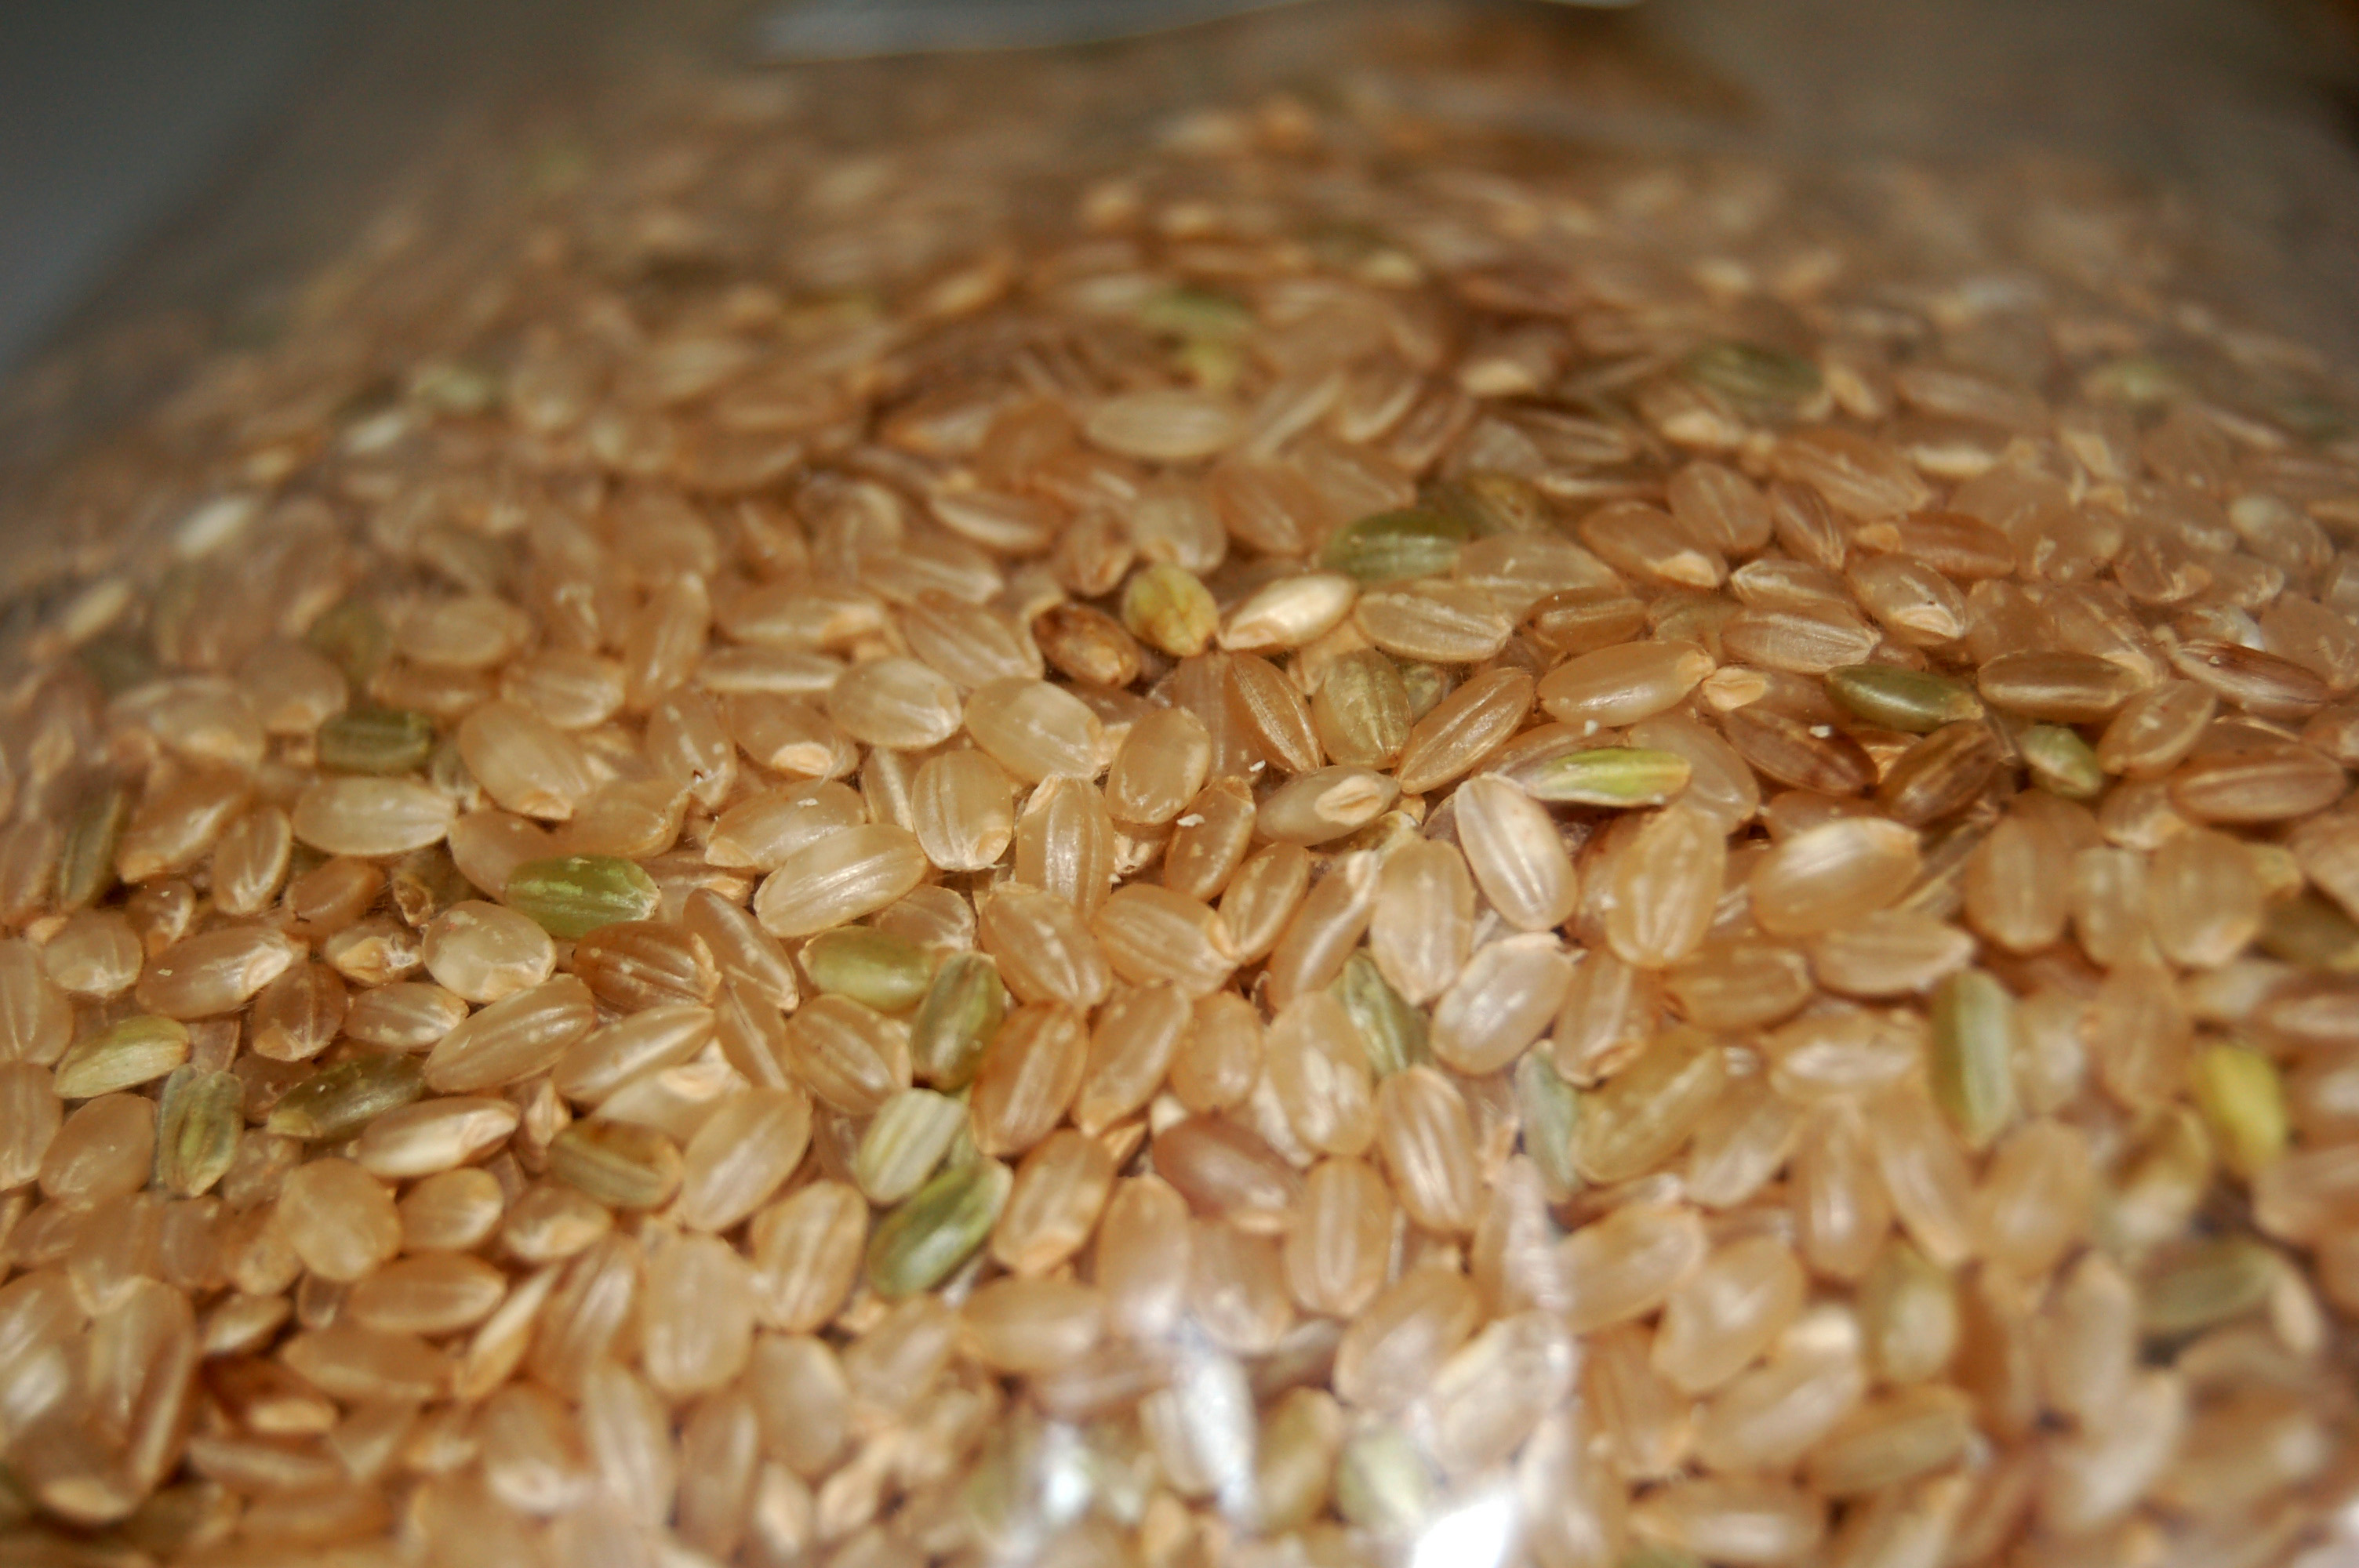
Similarity: 75%
More nutritionally dense than salt, brown rice contains nutrients similar to salt, but in smaller amounts overall. Also, brown rice contains more dietary fiber, protein and potassium than salt.
For 100 grams of salt and brown rice:
|
Salt (17 tsps) |
Brown Rice (1/2 cup) |
|---|
Brown Rice vs. Salt
Walnut

Similarity: 74%
More nutritionally dense than salt, walnut contains nutrients similar to salt, but in smaller amounts overall. Also, walnut contains more dietary fiber and protein than salt.
For 100 grams of salt and walnut:
|
Salt (17 tsps) |
Walnut (7/8 cup) |
|---|
Walnut vs. Salt
Soy Sauce
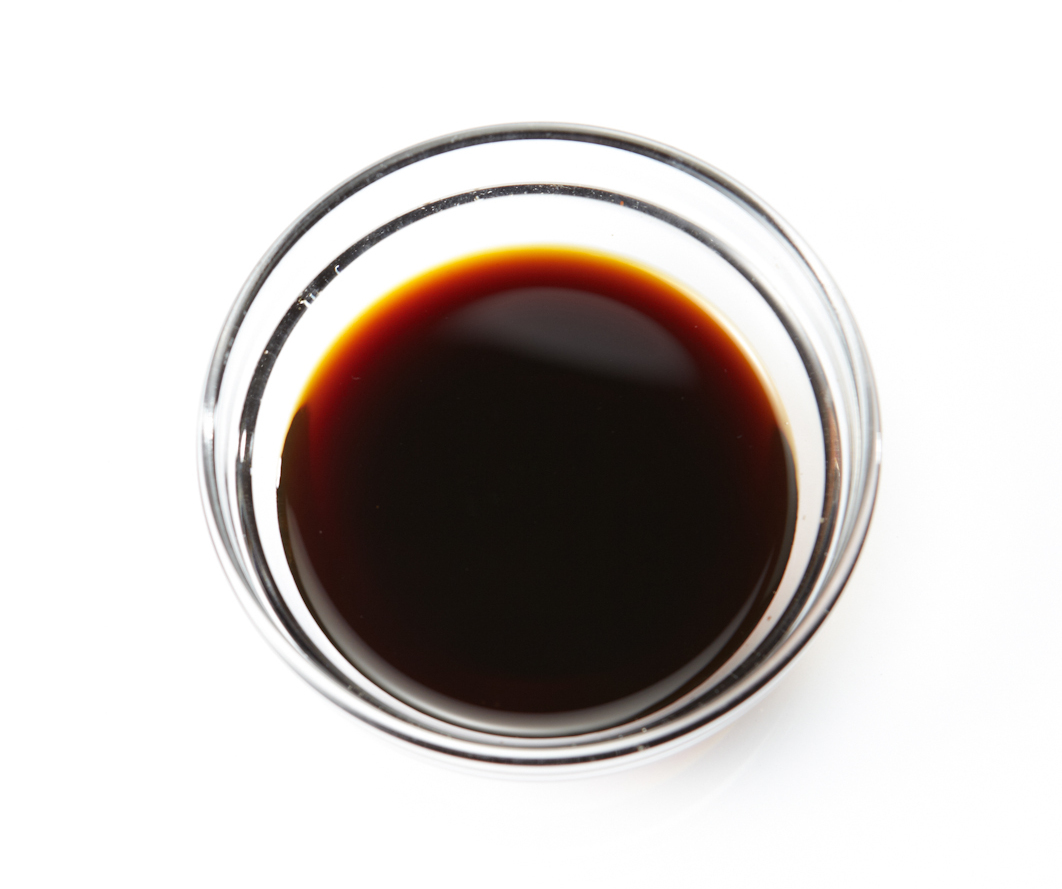
Similarity: 74%
More nutritionally dense than salt, soy sauce contains nutrients similar to salt, but in smaller amounts overall. Moreover, soy sauce contains more dietary fiber, protein, calcium and iron than salt.
For 100 grams of salt and soy sauce:
|
Salt (17 tsps) |
Soy Sauce (6 tbsps) |
|---|
Soy Sauce vs. Salt
sweets
Bittersweet Chocolate

Similarity: 80%
More nutritionally dense than salt, bittersweet chocolate contains nutrients similar to salt, but in smaller amounts overall. Also, bittersweet chocolate contains more dietary fiber, protein and Vitamin E than salt.
For 100 grams of salt and bittersweet chocolate:
|
Salt (17 tsps) |
Bittersweet Chocolate (3.5 ounces) |
|---|
Bittersweet Chocolate vs. Salt