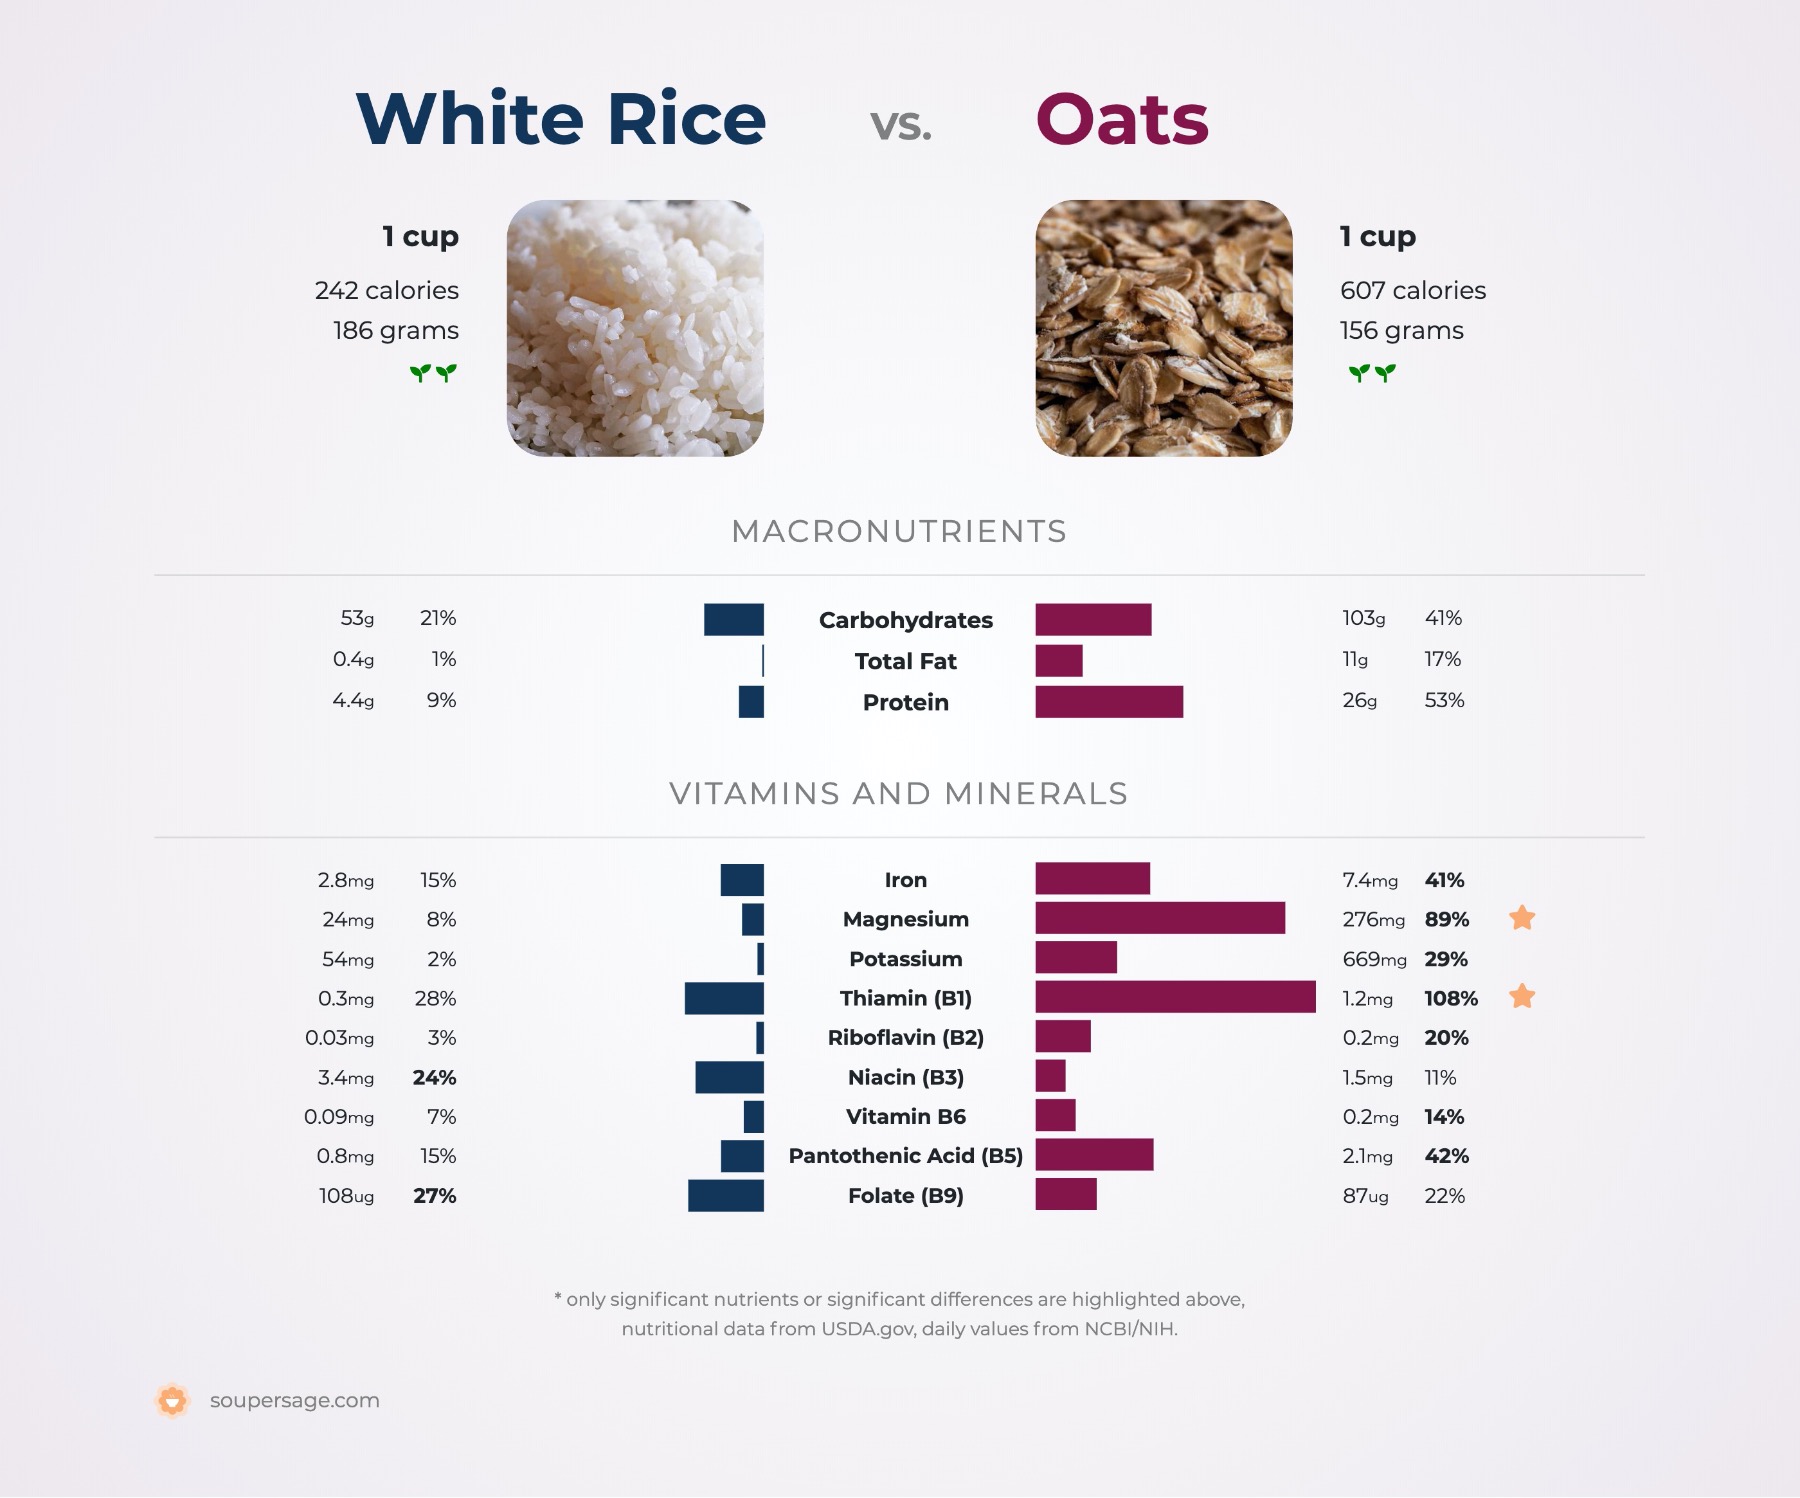
Oats vs. White Rice
Nutrition comparison of Oats and Cooked White Rice
Ever wonder how your favorite foods stack up against each other in terms of nutrition?
We compared the nutritional contents of
oats
versus
cooked
white rice
(100g each)
below using 2020 USDA and NIH data[1].
For a quick recap of significant nutrients and differences in oats and white rice:
- Both white rice and oats are high in calories.
- Oat has more thiamin, riboflavin, pantothenic acid and Vitamin B6.
- Oat is a great source of calcium.
- Oat is an excellent source of dietary fiber, iron, potassium and protein.
- White rice has 20.3 times less saturated fat than oat.
USDA sources for nutritional information: Oats (Oats (Includes foods for USDA's Food Distribution Program)) and White Rice (Rice, white, medium-grain, enriched, cooked) . Have a correction or suggestions? Shoot us an email.


Calories and Carbs
calories
Both white rice and oats are high in calories. Oat has 199% more calories than white rice - white rice has 130 calories per 100 grams and oat has 389 calories.
For macronutrient ratios, oats is heavier in protein, much lighter in carbs and heavier in fat compared to white rice per calorie. Oats has a macronutrient ratio of 17:67:16 and for white rice, 8:91:2 for protein, carbohydrates and fat from calories.
Macro Ratios from Calories:
| Oats | White Rice | |
|---|---|---|
| Protein | 17% | 8% |
| Carbohydrates | 67% | 91% |
| Fat | 16% | 2% |
| Alcohol | ~ | ~ |
carbohydrates
Oat is high in carbohydrates and white rice has 57% less carbohydrates than oat - white rice has 28.6g of total carbs per 100 grams and oat has 66.3g of carbohydrates.
dietary fiber
Oat is an excellent source of dietary fiber and it has 34 times more dietary fiber than white rice - white rice has 0.3g of dietary fiber per 100 grams and oat has 10.6g of dietary fiber.
Protein
protein
Oat is an excellent source of protein and it has 610% more protein than white rice - white rice has 2.4g of protein per 100 grams and oat has 16.9g of protein.
Fat
saturated fat
White rice has 20.3 times less saturated fat than oat - white rice has 0.06g of saturated fat per 100 grams and oat has 1.2g of saturated fat.
Vitamins
The B Vitamins
Oat has more thiamin, riboflavin, pantothenic acid and Vitamin B6. Both oats and white rice contain significant amounts of niacin and folate.
| Oats | White Rice | |
|---|---|---|
| Thiamin | 0.763 MG | 0.167 MG |
| Riboflavin | 0.139 MG | 0.016 MG |
| Niacin | 0.961 MG | 1.835 MG |
| Pantothenic acid | 1.349 MG | 0.411 MG |
| Vitamin B6 | 0.119 MG | 0.05 MG |
| Folate | 56 UG | 58 UG |
Minerals
calcium
Oat is a great source of calcium and it has 17 times more calcium than white rice - white rice has 3mg of calcium per 100 grams and oat has 54mg of calcium.
iron
Oat is an excellent source of iron and it has 217% more iron than white rice - white rice has 1.5mg of iron per 100 grams and oat has 4.7mg of iron.
potassium
Oat is an excellent source of potassium and it has 13 times more potassium than white rice - white rice has 29mg of potassium per 100 grams and oat has 429mg of potassium.
Omega-3 and Omega-6
omega 3s
For omega-3 fatty acids, oat has more alpha linoleic acid (ALA) than white rice per 100 grams.
| Oats | White Rice | |
|---|---|---|
| alpha linoleic acid | 0.111 G | 0.01 G |
| Total | 0.111 G | 0.01 G |
omega 6s
Comparing omega-6 fatty acids, oat has more linoleic acid than white rice per 100 grams.
| Oats | White Rice | |
|---|---|---|
| linoleic acid | 2.424 G | 0.046 G |
| Total | 2.424 G | 0.046 G |
Customize your serving size
The comparison below is by common portions, e.g. cups, packages. You can also see a more concrete comparison by weight at equal weight (by grams) comparison.
Note: The specific food items compared are: Oats (Oats (Includes foods for USDA's Food Distribution Program)) and White Rice (Rice, white, medium-grain, enriched, cooked) .
Oats g
()
|
Daily Values (%) |
Cooked White Rice g
()
|
|||||
|---|---|---|---|---|---|---|---|
| KCAL % |
|
5% | calories | 5% |
|
KCAL % | |
| G % |
|
5% | carbohydrates | 5% |
|
G % | |
| G % |
|
5% | dietary fiber | 5% |
|
G % | |
| G | 5% | sugar | 5% | G | |||
| G % |
|
5% | total fat | 5% |
|
G % | |
| G % |
|
5% | saturated fat | 5% |
|
G % | |
| G | 5% | monounsaturated fat | 5% | G | |||
| G | 5% | polyunsaturated fat | 5% | G | |||
| G | 5% | trans fat | 5% | G | |||
| MG | 5% | cholesterol | 5% | MG | |||
| MG % |
|
5% | sodium | 5% |
|
MG % | |
| 5% | Vitamins and Minerals | 5% | |||||
| UG % |
|
5% | Vitamin A | 5% |
|
UG % | |
| MG % |
|
5% | Vitamin C | 5% |
|
MG % | |
| IU % |
|
5% | Vitamin D | 5% |
|
IU % | |
| MG % |
|
5% | calcium | 5% |
|
MG % | |
| MG % |
|
5% | iron | 5% |
|
MG % | |
| MG % |
|
5% | magnesium | 5% |
|
MG % | |
| MG % |
|
5% | potassium | 5% |
|
MG % | |
| MG % |
|
5% | thiamin (Vit B1) | 5% |
|
MG % | |
| MG % |
|
5% | riboflavin (Vit B2) | 5% |
|
MG % | |
| MG % |
|
5% | niacin (Vit B3) | 5% |
|
MG % | |
| MG % |
|
5% | Vitamin B6 | 5% |
|
MG % | |
| MG % |
|
5% | pantothenic acid (Vit B5) | 5% |
|
MG % | |
| UG % |
|
5% | folate (Vit B9) | 5% |
|
UG % | |
| UG % |
|
5% | Vitamin B12 | 5% |
|
UG % | |
| MG % |
|
5% | Vitamin E | 5% |
|
MG % | |
| UG % |
|
5% | Vitamin K | 5% |
|
UG % | |
| G % |
|
5% | protein | 5% |
|
G % | |
| UG % |
|
5% | biotin (Vit B7) | 5% |
|
UG % | |
| MG % |
|
5% | choline | 5% |
|
MG % | |
| MG % |
|
5% | chlorine | 5% |
|
MG % | |
| UG % |
|
5% | chromium | 5% |
|
UG % | |
| MG % |
|
5% | copper | 5% |
|
MG % | |
| UG % |
|
5% | fluoride | 5% |
|
UG % | |
| UG % |
|
5% | iodine | 5% |
|
UG % | |
| MG % |
|
5% | manganese | 5% |
|
MG % | |
| UG % |
|
5% | molybdenum | 5% |
|
UG % | |
| MG % |
|
5% | phosphorus | 5% |
|
MG % | |
| UG % |
|
5% | selenium | 5% |
|
UG % | |
| MG % |
|
5% | zinc | 5% |
|
MG % | |
| G | 5% | Water | 5% | G | |||
| G | 5% | Starch | 5% | G | |||
| G | 5% | Alcohol | 5% | G | |||
FAQ
Does white rice or oats contain more calories in 100 grams?Both white rice and oats are high in calories. Oat has 200% more calories than white rice - white rice has 130 calories in 100g and oat has 389 calories.
Does white rice or oats have more carbohydrates?
By weight, oat is high in carbohydrates and white rice has 60% fewer carbohydrates than oat - white rice has 28.6g of carbs for 100g and oat has 66.3g of carbohydrates.
Does white rice or oats contain more iron?
Oat is an abundant source of iron and it has 220% more iron than white rice - white rice has 1.5mg of iron in 100 grams and oat has 4.7mg of iron.
Does white rice or oats contain more potassium?
Oat is a rich source of potassium and it has 13 times more potassium than white rice - white rice has 29mg of potassium in 100 grams and oat has 429mg of potassium.