Shrimp vs. Passion Fruit
Nutrition comparison of Shrimp and Passion Fruit
Ever wonder how your favorite foods stack up against each other in terms of nutrition?
We compared the nutritional contents of
shrimp
versus
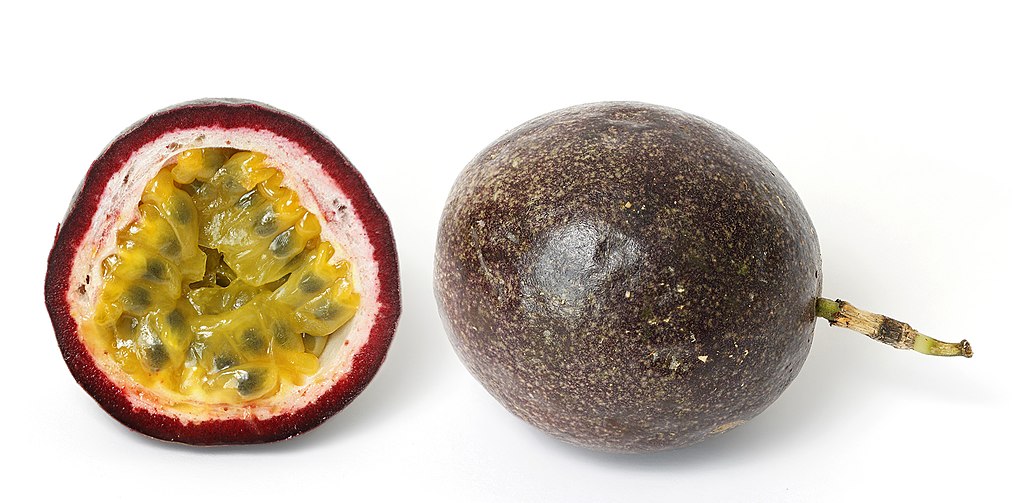
passion fruit
(100g each)
below using 2020 USDA and NIH data[1].
For a quick recap of significant nutrients and differences in shrimp and passion fruit:
- For omega-3 fatty acids, shrimp has more dha and epa than passion fruit.
- Passion fruit has signficantly less cholesterol than shrimp.
- Passion fruit is an excellent source of Vitamin C, dietary fiber and potassium.
- Shrimp has more thiamin, pantothenic acid and Vitamin B12, however, passion fruit contains more riboflavin.
- Shrimp has signficantly less carbohydrates than passion fruit.
- Shrimp is a great source of calcium.
- Shrimp is an excellent source of protein.
USDA sources for nutritional information: Shrimp (Crustaceans, shrimp, mixed species, raw (may contain additives to retain moisture)) and Passion Fruit (Passion-fruit, (granadilla), purple, raw) . Have a correction or suggestions? Shoot us an email.

Calories and Carbs
calories
Shrimp has 27% less calories than passion fruit - passion fruit has 97 calories per 100 grams and shrimp has 71 calories.
For macronutrient ratios, shrimp is much heavier in protein, much lighter in carbs and heavier in fat compared to passion fruit per calorie. Shrimp has a macronutrient ratio of 71:9:20 and for passion fruit, 8:86:6 for protein, carbohydrates and fat from calories.
Macro Ratios from Calories:
| Shrimp | Passion Fruit | |
|---|---|---|
| Protein | 71% | 8% |
| Carbohydrates | 9% | 86% |
| Fat | 20% | 6% |
| Alcohol | ~ | ~ |
carbohydrates
Shrimp has signficantly less carbohydrates than passion fruit - passion fruit has 23.4g of total carbs per 100 grams and shrimp has 0.91g of carbohydrates.
dietary fiber
Passion fruit is an excellent source of dietary fiber and it has more dietary fiber than shrimp - passion fruit has 10.4g of dietary fiber per 100 grams and shrimp does not contain significant amounts.
sugar
Shrimp has less sugar than passion fruit - passion fruit has 11.2g of sugar per 100 grams and shrimp does not contain significant amounts.
Protein
protein
Shrimp is an excellent source of protein and it has 519% more protein than passion fruit - passion fruit has 2.2g of protein per 100 grams and shrimp has 13.6g of protein.
Fat
saturated fat
Both passion fruit and shrimp are low in saturated fat - passion fruit has 0.06g of saturated fat per 100 grams and shrimp has 0.26g of saturated fat.
trans fat
Both shrimp and passion fruit are low in trans fat - shrimp has 0.02g of trans fat per 100 grams and passion fruit does not contain significant amounts.
cholesterol
Passion fruit has signficantly less cholesterol than shrimp - shrimp has 126mg of cholesterol per 100 grams and passion fruit does not contain significant amounts.
Vitamins
Vitamin C
Passion fruit is an excellent source of Vitamin C and it has more Vitamin C than shrimp - passion fruit has 30mg of Vitamin C per 100 grams and shrimp does not contain significant amounts.
Vitamin A
Passion fruit and shrimp contain similar amounts of Vitamin A - passion fruit has 64ug of Vitamin A per 100 grams and shrimp has 54ug of Vitamin A.
Vitamin D
Shrimp and passion fruit contain similar amounts of Vitamin D - shrimp has 2iu of Vitamin D per 100 grams and passion fruit does not contain significant amounts.
Vitamin E
Passion fruit and shrimp contain similar amounts of Vitamin E - passion fruit has 0.02mg of Vitamin E per 100 grams and shrimp has 1.3mg of Vitamin E.
Vitamin K
Passion fruit and shrimp contain similar amounts of Vitamin K - passion fruit has 0.7ug of Vitamin K per 100 grams and shrimp has 0.3ug of Vitamin K.
The B Vitamins
Shrimp has more thiamin, pantothenic acid and Vitamin B12, however, passion fruit contains more riboflavin. Both shrimp and passion fruit contain significant amounts of niacin, Vitamin B6 and folate.
| Shrimp | Passion Fruit | |
|---|---|---|
| Thiamin | 0.02 MG | ~ |
| Riboflavin | 0.015 MG | 0.13 MG |
| Niacin | 1.778 MG | 1.5 MG |
| Pantothenic acid | 0.31 MG | ~ |
| Vitamin B6 | 0.161 MG | 0.1 MG |
| Folate | 19 UG | 14 UG |
| Vitamin B12 | 1.11 UG | ~ |
Minerals
calcium
Shrimp is a great source of calcium and it has 350% more calcium than passion fruit - passion fruit has 12mg of calcium per 100 grams and shrimp has 54mg of calcium.
iron
Passion fruit has 662% more iron than shrimp - passion fruit has 1.6mg of iron per 100 grams and shrimp has 0.21mg of iron.
potassium
Passion fruit is an excellent source of potassium and it has 208% more potassium than shrimp - passion fruit has 348mg of potassium per 100 grams and shrimp has 113mg of potassium.
Omega-3 and Omega-6
omega 3s
For omega-3 fatty acids, shrimp has more DHA and EPA than passion fruit per 100 grams. Both shrimp and passion fruit contain small amounts of alpha linoleic acid (ALA).
| Shrimp | Passion Fruit | |
|---|---|---|
| alpha linoleic acid | 0.006 G | 0.001 G |
| DHA | 0.07 G | ~ |
| EPA | 0.068 G | ~ |
| DPA | 0.006 G | ~ |
| Total | 0.15 G | 0.001 G |
omega 6s
Comparing omega-6 fatty acids, passion fruit has more linoleic acid than shrimp per 100 grams.
| Shrimp | Passion Fruit | |
|---|---|---|
| other omega 6 | 0.006 G | ~ |
| linoleic acid | 0.095 G | 0.41 G |
| Total | 0.101 G | 0.41 G |
Customize your serving size
The comparison below is by common portions, e.g. cups, packages. You can also see a more concrete comparison by weight at equal weight (by grams) comparison.
Note: The specific food items compared are: Shrimp (Crustaceans, shrimp, mixed species, raw (may contain additives to retain moisture)) and Passion Fruit (Passion-fruit, (granadilla), purple, raw) .
Shrimp g
()
|
Daily Values (%) |
Passion Fruit g
()
|
|||||
|---|---|---|---|---|---|---|---|
| KCAL % |
|
5% | calories | 5% |
|
KCAL % | |
| G % |
|
5% | carbohydrates | 5% |
|
G % | |
| G % |
|
5% | dietary fiber | 5% |
|
G % | |
| G | 5% | sugar | 5% | G | |||
| G % |
|
5% | total fat | 5% |
|
G % | |
| G % |
|
5% | saturated fat | 5% |
|
G % | |
| G | 5% | monounsaturated fat | 5% | G | |||
| G | 5% | polyunsaturated fat | 5% | G | |||
| G | 5% | trans fat | 5% | G | |||
| MG | 5% | cholesterol | 5% | MG | |||
| MG % |
|
5% | sodium | 5% |
|
MG % | |
| 5% | Vitamins and Minerals | 5% | |||||
| UG % |
|
5% | Vitamin A | 5% |
|
UG % | |
| MG % |
|
5% | Vitamin C | 5% |
|
MG % | |
| IU % |
|
5% | Vitamin D | 5% |
|
IU % | |
| MG % |
|
5% | calcium | 5% |
|
MG % | |
| MG % |
|
5% | iron | 5% |
|
MG % | |
| MG % |
|
5% | magnesium | 5% |
|
MG % | |
| MG % |
|
5% | potassium | 5% |
|
MG % | |
| MG % |
|
5% | thiamin (Vit B1) | 5% |
|
MG % | |
| MG % |
|
5% | riboflavin (Vit B2) | 5% |
|
MG % | |
| MG % |
|
5% | niacin (Vit B3) | 5% |
|
MG % | |
| MG % |
|
5% | Vitamin B6 | 5% |
|
MG % | |
| MG % |
|
5% | pantothenic acid (Vit B5) | 5% |
|
MG % | |
| UG % |
|
5% | folate (Vit B9) | 5% |
|
UG % | |
| UG % |
|
5% | Vitamin B12 | 5% |
|
UG % | |
| MG % |
|
5% | Vitamin E | 5% |
|
MG % | |
| UG % |
|
5% | Vitamin K | 5% |
|
UG % | |
| G % |
|
5% | protein | 5% |
|
G % | |
| UG % |
|
5% | biotin (Vit B7) | 5% |
|
UG % | |
| MG % |
|
5% | choline | 5% |
|
MG % | |
| MG % |
|
5% | chlorine | 5% |
|
MG % | |
| UG % |
|
5% | chromium | 5% |
|
UG % | |
| MG % |
|
5% | copper | 5% |
|
MG % | |
| UG % |
|
5% | fluoride | 5% |
|
UG % | |
| UG % |
|
5% | iodine | 5% |
|
UG % | |
| MG % |
|
5% | manganese | 5% |
|
MG % | |
| UG % |
|
5% | molybdenum | 5% |
|
UG % | |
| MG % |
|
5% | phosphorus | 5% |
|
MG % | |
| UG % |
|
5% | selenium | 5% |
|
UG % | |
| MG % |
|
5% | zinc | 5% |
|
MG % | |
| G | 5% | Water | 5% | G | |||
| G | 5% | Starch | 5% | G | |||
| G | 5% | Alcohol | 5% | G | |||
FAQ
Does passion fruit or shrimp contain more calories in 100 grams?Shrimp has 30% less calories than passion fruit - passion fruit has 97 calories in 100g and shrimp has 71 calories.
Is passion fruit or shrimp better for protein?
Shrimp is a fantastic source of protein and it has 520% more protein than passion fruit - passion fruit has 2.2g of protein per 100 grams and shrimp has 13.6g of protein.
Does passion fruit or shrimp have more carbohydrates?
By weight, shrimp has signficantly fewer carbohydrates than passion fruit - passion fruit has 23.4g of carbs for 100g and shrimp has 0.91g of carbohydrates.
Does passion fruit or shrimp contain more potassium?
Passion fruit is a rich source of potassium and it has 210% more potassium than shrimp - passion fruit has 348mg of potassium in 100 grams and shrimp has 113mg of potassium.