Beef vs. Shrimp
Nutrition comparison of Cooked Beef and Shrimp
Ever wonder how your favorite foods stack up against each other in terms of nutrition?
We compared the nutritional contents of
cooked
beef
versus
shrimp
(100g each)
below using 2020 USDA and NIH data[1].
For a quick recap of significant nutrients and differences in beef and shrimp:
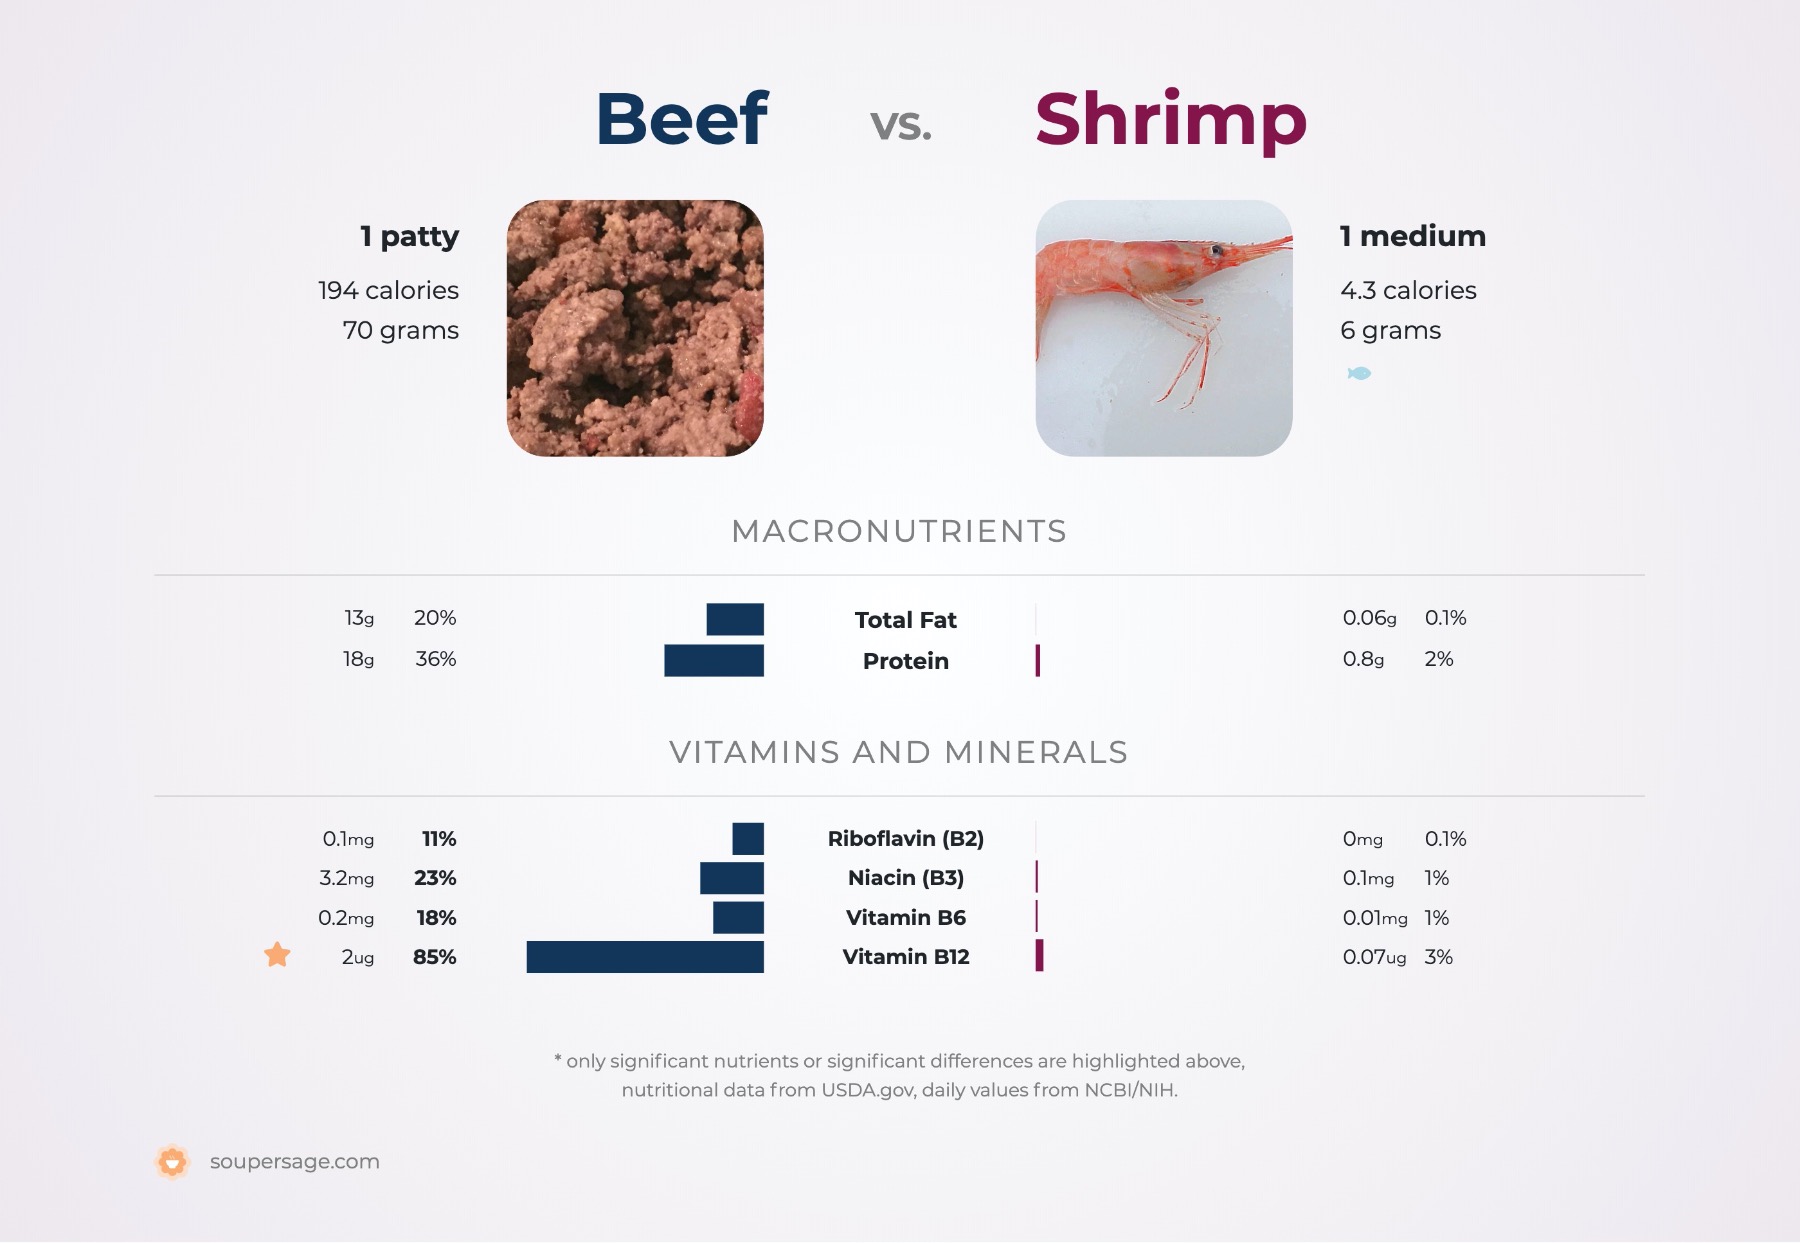
- Both beef and shrimp are high in protein.
- Beef has more thiamin, riboflavin, niacin, pantothenic acid, Vitamin B6 and Vitamin B12.
- Beef is a great source of iron and potassium.
- Shrimp has 63.8 times less trans fat than beef.
- Shrimp is a great source of calcium.
USDA sources for nutritional information: Beef (Beef, ground, 70% lean meat / 30% fat, patty, cooked, broiled) and Shrimp (Crustaceans, shrimp, mixed species, raw (may contain additives to retain moisture)) . Have a correction or suggestions? Shoot us an email.


Calories and Carbs
calories
Beef is high in calories and shrimp has 74% less calories than beef - beef has 277 calories per 100 grams and shrimp has 71 calories.
For macronutrient ratios, beef is much lighter in protein, lighter in carbs and much heavier in fat compared to shrimp per calorie. Beef has a macronutrient ratio of 38:0:62 and for shrimp, 71:9:20 for protein, carbohydrates and fat from calories.
Macro Ratios from Calories:
| Beef | Shrimp | |
|---|---|---|
| Protein | 38% | 71% |
| Carbohydrates | ~ | 9% |
| Fat | 62% | 20% |
| Alcohol | ~ | ~ |
carbohydrates
Both shrimp and beef are low in carbohydrates - shrimp has 0.91g of total carbs per 100 grams and beef does not contain significant amounts.
Protein
protein
Both beef and shrimp are high in protein. Beef has 86% more protein than shrimp - beef has 25.4g of protein per 100 grams and shrimp has 13.6g of protein.
Fat
saturated fat
Beef is high in saturated fat and shrimp has 96% less saturated fat than beef - beef has 7.3g of saturated fat per 100 grams and shrimp has 0.26g of saturated fat.
trans fat
Shrimp has 63.8 times less trans fat than beef - beef has 1.2g of trans fat per 100 grams and shrimp has 0.02g of trans fat.
cholesterol
Beef has 30% less cholesterol than shrimp - beef has 88mg of cholesterol per 100 grams and shrimp has 126mg of cholesterol.
Vitamins
Vitamin A
Shrimp has 17 times more Vitamin A than beef - beef has 3ug of Vitamin A per 100 grams and shrimp has 54ug of Vitamin A.
Vitamin D
Beef and shrimp contain similar amounts of Vitamin D - beef has 2iu of Vitamin D per 100 grams and shrimp has 2iu of Vitamin D.
Vitamin E
Beef and shrimp contain similar amounts of Vitamin E - beef has 0.12mg of Vitamin E per 100 grams and shrimp has 1.3mg of Vitamin E.
Vitamin K
Beef and shrimp contain similar amounts of Vitamin K - beef has 3ug of Vitamin K per 100 grams and shrimp has 0.3ug of Vitamin K.
The B Vitamins
Beef has more thiamin, riboflavin, niacin, pantothenic acid, Vitamin B6 and Vitamin B12. Both beef and shrimp contain significant amounts of folate.
| Beef | Shrimp | |
|---|---|---|
| Thiamin | 0.051 MG | 0.02 MG |
| Riboflavin | 0.176 MG | 0.015 MG |
| Niacin | 4.537 MG | 1.778 MG |
| Pantothenic acid | 0.658 MG | 0.31 MG |
| Vitamin B6 | 0.336 MG | 0.161 MG |
| Folate | 11 UG | 19 UG |
| Vitamin B12 | 2.9 UG | 1.11 UG |
Minerals
calcium
Shrimp is a great source of calcium and it has 54% more calcium than beef - beef has 35mg of calcium per 100 grams and shrimp has 54mg of calcium.
iron
Beef is a great source of iron and it has 971% more iron than shrimp - beef has 2.3mg of iron per 100 grams and shrimp has 0.21mg of iron.
potassium
Beef is a great source of potassium and it has 143% more potassium than shrimp - beef has 275mg of potassium per 100 grams and shrimp has 113mg of potassium.
Omega-3 and Omega-6
omega 3s
For omega-3 fatty acids, beef has more alpha linoleic acid (ALA) than shrimp per 100 grams, however, shrimp contains more dha and epa than beef per 100 grams.
| Beef | Shrimp | |
|---|---|---|
| alpha linoleic acid | 0.056 G | 0.006 G |
| DHA | ~ | 0.07 G |
| EPA | ~ | 0.068 G |
| DPA | ~ | 0.006 G |
| Total | 0.056 G | 0.15 G |
omega 6s
Comparing omega-6 fatty acids, beef has more linoleic acid than shrimp per 100 grams.
| Beef | Shrimp | |
|---|---|---|
| other omega 6 | ~ | 0.006 G |
| linoleic acid | 0.39 G | 0.095 G |
| Total | 0.39 G | 0.101 G |
Customize your serving size
The comparison below is by common portions, e.g. cups, packages. You can also see a more concrete comparison by weight at equal weight (by grams) comparison.
Cooked Beef g
()
|
Daily Values (%) |
Shrimp g
()
|
|||||
|---|---|---|---|---|---|---|---|
| KCAL % |
|
5% | calories | 5% |
|
KCAL % | |
| G % |
|
5% | carbohydrates | 5% |
|
G % | |
| G % |
|
5% | dietary fiber | 5% |
|
G % | |
| G | 5% | sugar | 5% | G | |||
| G % |
|
5% | total fat | 5% |
|
G % | |
| G % |
|
5% | saturated fat | 5% |
|
G % | |
| G | 5% | monounsaturated fat | 5% | G | |||
| G | 5% | polyunsaturated fat | 5% | G | |||
| G | 5% | trans fat | 5% | G | |||
| MG | 5% | cholesterol | 5% | MG | |||
| MG % |
|
5% | sodium | 5% |
|
MG % | |
| 5% | Vitamins and Minerals | 5% | |||||
| UG % |
|
5% | Vitamin A | 5% |
|
UG % | |
| MG % |
|
5% | Vitamin C | 5% |
|
MG % | |
| IU % |
|
5% | Vitamin D | 5% |
|
IU % | |
| MG % |
|
5% | calcium | 5% |
|
MG % | |
| MG % |
|
5% | iron | 5% |
|
MG % | |
| MG % |
|
5% | magnesium | 5% |
|
MG % | |
| MG % |
|
5% | potassium | 5% |
|
MG % | |
| MG % |
|
5% | thiamin (Vit B1) | 5% |
|
MG % | |
| MG % |
|
5% | riboflavin (Vit B2) | 5% |
|
MG % | |
| MG % |
|
5% | niacin (Vit B3) | 5% |
|
MG % | |
| MG % |
|
5% | Vitamin B6 | 5% |
|
MG % | |
| MG % |
|
5% | pantothenic acid (Vit B5) | 5% |
|
MG % | |
| UG % |
|
5% | folate (Vit B9) | 5% |
|
UG % | |
| UG % |
|
5% | Vitamin B12 | 5% |
|
UG % | |
| MG % |
|
5% | Vitamin E | 5% |
|
MG % | |
| UG % |
|
5% | Vitamin K | 5% |
|
UG % | |
| G % |
|
5% | protein | 5% |
|
G % | |
| UG % |
|
5% | biotin (Vit B7) | 5% |
|
UG % | |
| MG % |
|
5% | choline | 5% |
|
MG % | |
| MG % |
|
5% | chlorine | 5% |
|
MG % | |
| UG % |
|
5% | chromium | 5% |
|
UG % | |
| MG % |
|
5% | copper | 5% |
|
MG % | |
| UG % |
|
5% | fluoride | 5% |
|
UG % | |
| UG % |
|
5% | iodine | 5% |
|
UG % | |
| MG % |
|
5% | manganese | 5% |
|
MG % | |
| UG % |
|
5% | molybdenum | 5% |
|
UG % | |
| MG % |
|
5% | phosphorus | 5% |
|
MG % | |
| UG % |
|
5% | selenium | 5% |
|
UG % | |
| MG % |
|
5% | zinc | 5% |
|
MG % | |
| G | 5% | Water | 5% | G | |||
| G | 5% | Starch | 5% | G | |||
| G | 5% | Alcohol | 5% | G | |||
FAQ
Does beef or shrimp contain more calories in 100 grams?Beef is high in calories and shrimp has 70% less calories than beef - beef has 277 calories in 100g and shrimp has 71 calories.
Is beef or shrimp better for protein?
Both beef and shrimp are high in protein. Beef has 90% more protein than shrimp - beef has 25.4g of protein per 100 grams and shrimp has 13.6g of protein.