Kale vs. Spinach
Nutrition comparison of Kale and Spinach
Ever wonder how your favorite foods stack up against each other in terms of nutrition?
We compared the nutritional contents of
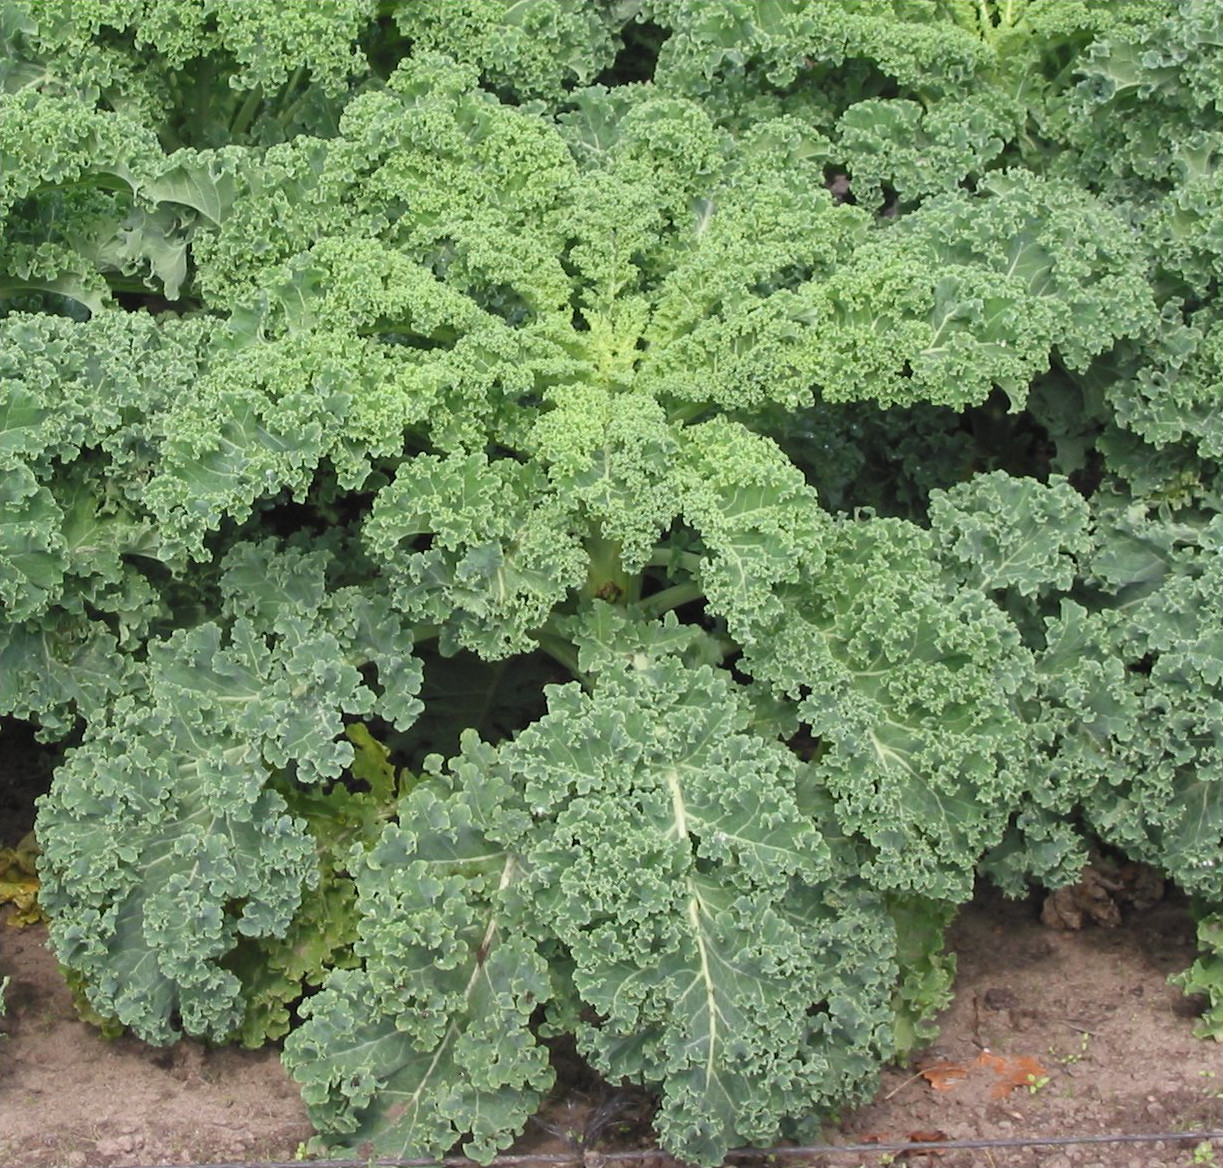
kale
versus
spinach
(100g each)
below using 2020 USDA and NIH data[1].
For a quick recap of significant nutrients and differences in kale and spinach:
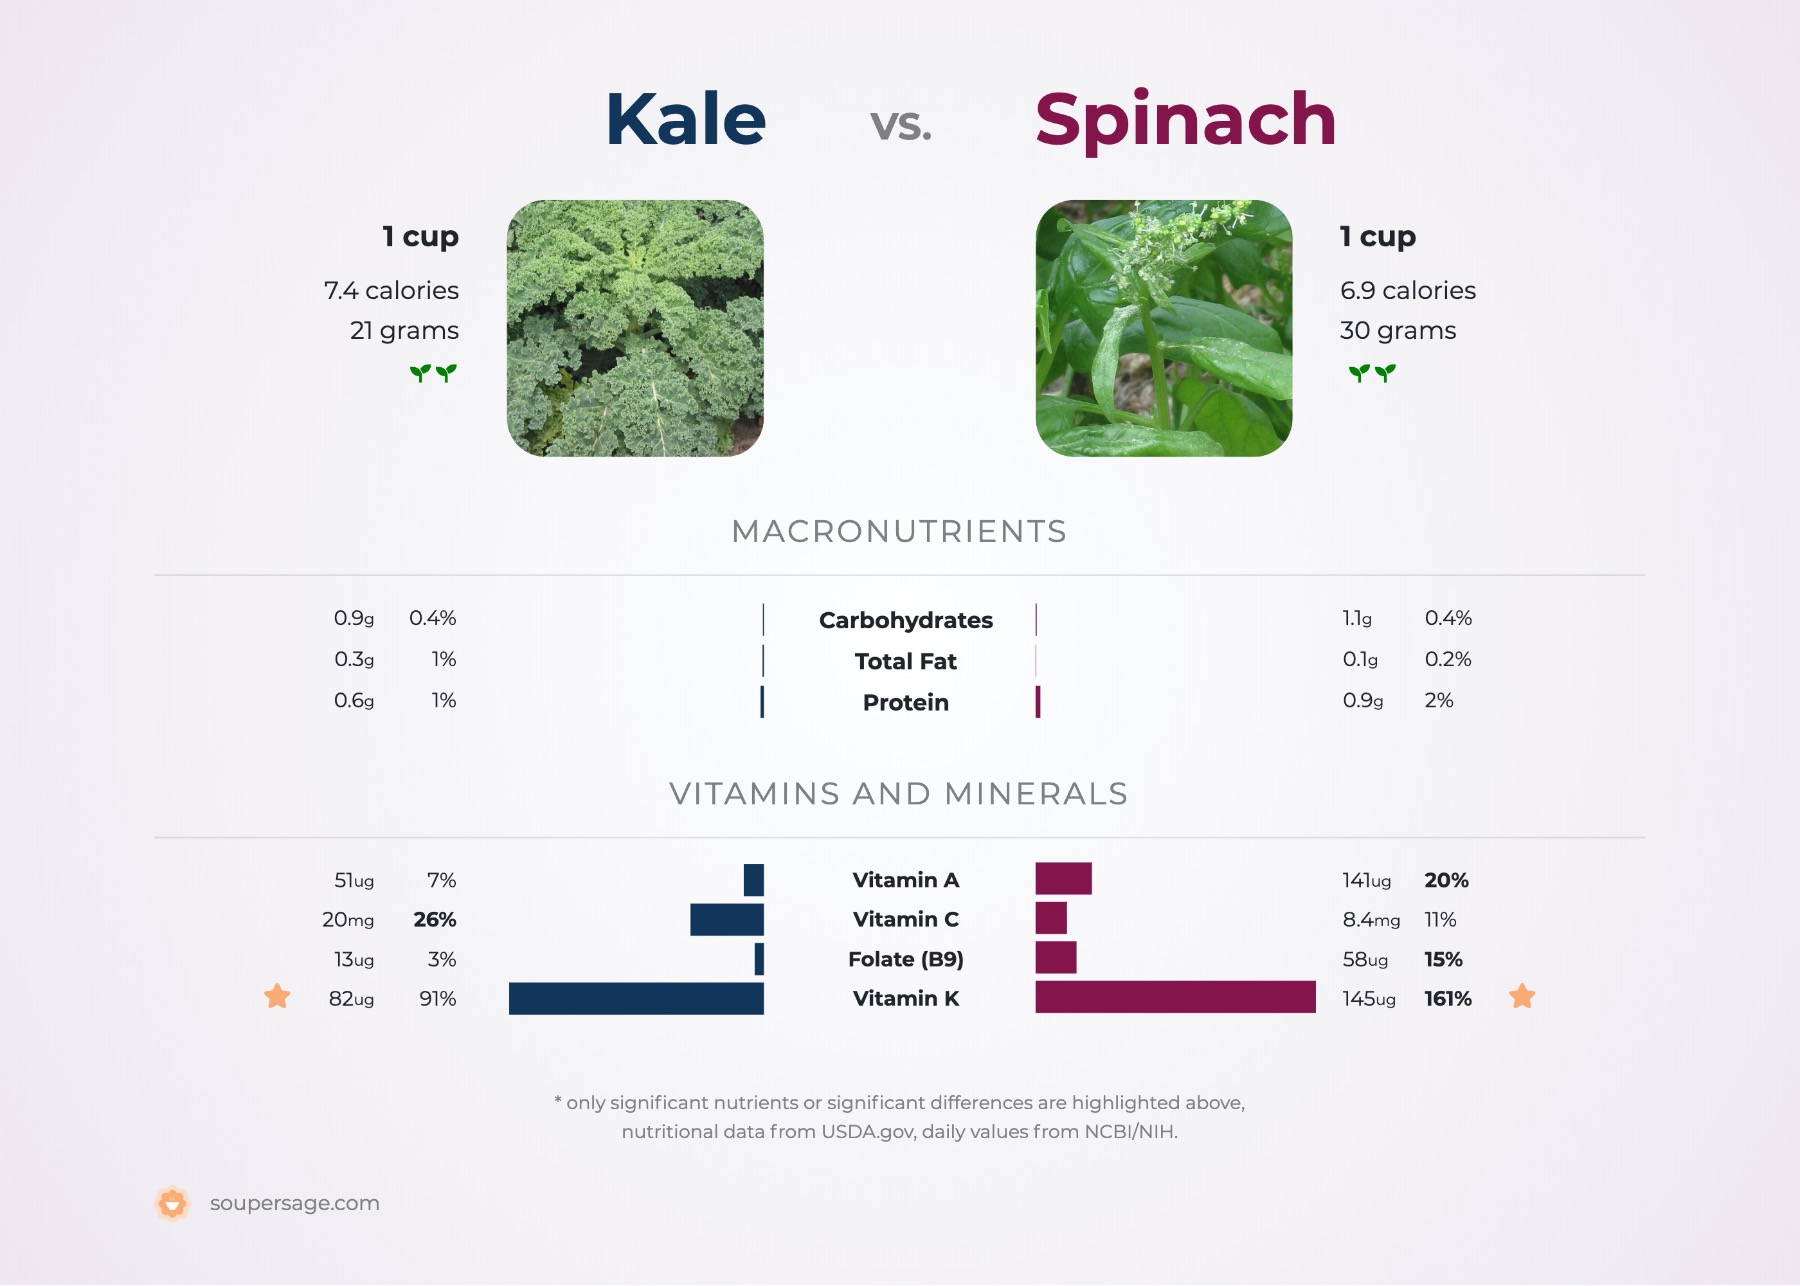
- Both kale and spinach are high in Vitamin A, Vitamin C, Vitamin K, calcium, dietary fiber and potassium.
- Kale has more pantothenic acid, however, spinach contains more folate.
- Spinach is a great source of iron.
USDA sources for nutritional information: Kale (Kale, raw) and Spinach (Spinach, raw) . Have a correction or suggestions? Shoot us an email.

Calories and Carbs
calories
Kale and spinach contain similar amounts of calories - kale has 35 calories per 100 grams and spinach has 23 calories.
For macronutrient ratios, kale is lighter in protein, lighter in carbs and heavier in fat compared to spinach per calorie. Kale has a macronutrient ratio of 27:41:32 and for spinach, 39:49:12 for protein, carbohydrates and fat from calories.
Macro Ratios from Calories:
| Kale | Spinach | |
|---|---|---|
| Protein | 27% | 39% |
| Carbohydrates | 41% | 49% |
| Fat | 32% | 12% |
| Alcohol | ~ | ~ |
carbohydrates
Both kale and spinach are low in carbohydrates - kale has 4.4g of total carbs per 100 grams and spinach has 3.6g of carbohydrates.
dietary fiber
Both kale and spinach are high in dietary fiber. Kale has 86% more dietary fiber than spinach - kale has 4.1g of dietary fiber per 100 grams and spinach has 2.2g of dietary fiber.
sugar
Kale and spinach contain similar amounts of sugar - kale has 0.99g of sugar per 100 grams and spinach has 0.42g of sugar.
Protein
protein
Kale and spinach contain similar amounts of protein - kale has 2.9g of protein per 100 grams and spinach has 2.9g of protein.
Fat
saturated fat
Both kale and spinach are low in saturated fat - kale has 0.18g of saturated fat per 100 grams and spinach has 0.06g of saturated fat.
Vitamins
Vitamin C
Both kale and spinach are high in Vitamin C. Kale has 232% more Vitamin C than spinach - kale has 93.4mg of Vitamin C per 100 grams and spinach has 28.1mg of Vitamin C.
Vitamin A
Both kale and spinach are high in Vitamin A. Spinach has 95% more Vitamin A than kale - kale has 241ug of Vitamin A per 100 grams and spinach has 469ug of Vitamin A.
Vitamin E
Kale and spinach contain similar amounts of Vitamin E - kale has 0.66mg of Vitamin E per 100 grams and spinach has 2mg of Vitamin E.
Vitamin K
Both kale and spinach are high in Vitamin K. Spinach has 24% more Vitamin K than kale - kale has 389.6ug of Vitamin K per 100 grams and spinach has 482.9ug of Vitamin K.
The B Vitamins
Kale has more pantothenic acid, however, spinach contains more folate. Both kale and spinach contain significant amounts of thiamin, riboflavin, niacin and Vitamin B6.
| Kale | Spinach | |
|---|---|---|
| Thiamin | 0.113 MG | 0.078 MG |
| Riboflavin | 0.347 MG | 0.189 MG |
| Niacin | 1.18 MG | 0.724 MG |
| Pantothenic acid | 0.37 MG | 0.065 MG |
| Vitamin B6 | 0.147 MG | 0.195 MG |
| Folate | 62 UG | 194 UG |
Minerals
calcium
Both kale and spinach are high in calcium. Kale has 157% more calcium than spinach - kale has 254mg of calcium per 100 grams and spinach has 99mg of calcium.
iron
Spinach is a great source of iron and it has 69% more iron than kale - kale has 1.6mg of iron per 100 grams and spinach has 2.7mg of iron.
potassium
Both kale and spinach are high in potassium. Spinach has 60% more potassium than kale - kale has 348mg of potassium per 100 grams and spinach has 558mg of potassium.
Antioxidants and Phytonutrients
flavonoids
Naturally occuring in fruits and vegetables, flavonoids are associated with many health benefits and used in a variety of medicinal and pharmaceutical applications. [2][3]
For specific flavonoid compounds, kale has more isorhamnetin, kaempferol and quercetin than spinach per 100 grams, however, spinach contains more luteolin and myricetin than kale per 100 grams.
| Kale | Spinach | |
|---|---|---|
| isorhamnetin | 23.6 mg | ~ |
| kaempferol | 46.8 mg | 6.38 mg |
| Quercetin | 22.58 mg | 3.97 mg |
| luteolin | ~ | 0.74 mg |
| myricetin | ~ | 0.35 mg |
carotenoids
Carotenoids are micronutrients commonly found in plants and some animal products. An example is beta-carotene, the notable carotenoid which is a popular source of Vitamin A.[4][5]
For specific types of carotenoids, both kale and spinach contain significant amounts of beta-carotene and lutein + zeaxanthin.
| Kale | Spinach | |
|---|---|---|
| beta-carotene | 2873 UG | 5626 UG |
| lutein + zeaxanthin | 6261 UG | 12198 UG |
Omega-3 and Omega-6
omega 3s
For omega-3 fatty acids, kale has more alpha linoleic acid (ALA) than spinach per 100 grams.
| Kale | Spinach | |
|---|---|---|
| alpha linoleic acid | 0.378 G | 0.138 G |
| Total | 0.378 G | 0.138 G |
omega 6s
Comparing omega-6 fatty acids, kale has more linoleic acid than spinach per 100 grams.
| Kale | Spinach | |
|---|---|---|
| linoleic acid | 0.291 G | 0.026 G |
| other omega 6 | 0.003 G | ~ |
| Total | 0.294 G | 0.026 G |
Customize your serving size
The comparison below is by weight, but sometimes 100g isn't that intuitive of a measurement for food. View a custom portion comparison (e.g. cups, oz, package).
You can try adding or subtracting the amount of either Kale or Spinach .
Kale g
()
|
Daily Values (%) |
Spinach g
()
|
|||||
|---|---|---|---|---|---|---|---|
| KCAL % |
|
5% | calories | 5% |
|
KCAL % | |
| G % |
|
5% | carbohydrates | 5% |
|
G % | |
| G % |
|
5% | dietary fiber | 5% |
|
G % | |
| G | 5% | sugar | 5% | G | |||
| G % |
|
5% | total fat | 5% |
|
G % | |
| G % |
|
5% | saturated fat | 5% |
|
G % | |
| G | 5% | monounsaturated fat | 5% | G | |||
| G | 5% | polyunsaturated fat | 5% | G | |||
| G | 5% | trans fat | 5% | G | |||
| MG | 5% | cholesterol | 5% | MG | |||
| MG % |
|
5% | sodium | 5% |
|
MG % | |
| 5% | Vitamins and Minerals | 5% | |||||
| UG % |
|
5% | Vitamin A | 5% |
|
UG % | |
| MG % |
|
5% | Vitamin C | 5% |
|
MG % | |
| IU % |
|
5% | Vitamin D | 5% |
|
IU % | |
| MG % |
|
5% | calcium | 5% |
|
MG % | |
| MG % |
|
5% | iron | 5% |
|
MG % | |
| MG % |
|
5% | magnesium | 5% |
|
MG % | |
| MG % |
|
5% | potassium | 5% |
|
MG % | |
| MG % |
|
5% | thiamin (Vit B1) | 5% |
|
MG % | |
| MG % |
|
5% | riboflavin (Vit B2) | 5% |
|
MG % | |
| MG % |
|
5% | niacin (Vit B3) | 5% |
|
MG % | |
| MG % |
|
5% | Vitamin B6 | 5% |
|
MG % | |
| MG % |
|
5% | pantothenic acid (Vit B5) | 5% |
|
MG % | |
| UG % |
|
5% | folate (Vit B9) | 5% |
|
UG % | |
| UG % |
|
5% | Vitamin B12 | 5% |
|
UG % | |
| MG % |
|
5% | Vitamin E | 5% |
|
MG % | |
| UG % |
|
5% | Vitamin K | 5% |
|
UG % | |
| G % |
|
5% | protein | 5% |
|
G % | |
| UG % |
|
5% | biotin (Vit B7) | 5% |
|
UG % | |
| MG % |
|
5% | choline | 5% |
|
MG % | |
| MG % |
|
5% | chlorine | 5% |
|
MG % | |
| UG % |
|
5% | chromium | 5% |
|
UG % | |
| MG % |
|
5% | copper | 5% |
|
MG % | |
| UG % |
|
5% | fluoride | 5% |
|
UG % | |
| UG % |
|
5% | iodine | 5% |
|
UG % | |
| MG % |
|
5% | manganese | 5% |
|
MG % | |
| UG % |
|
5% | molybdenum | 5% |
|
UG % | |
| MG % |
|
5% | phosphorus | 5% |
|
MG % | |
| UG % |
|
5% | selenium | 5% |
|
UG % | |
| MG % |
|
5% | zinc | 5% |
|
MG % | |
| G | 5% | Water | 5% | G | |||
| G | 5% | Starch | 5% | G | |||
| G | 5% | Alcohol | 5% | G | |||
FAQ
Does kale or spinach contain more calories in 100 grams?Kale and spinach contain similar amounts of calories - kale has 35 calories in 100g and spinach has 23 calories.
Is kale or spinach better for protein?
Kale and spinach contain similar amounts of protein - kale has 2.9g of protein per 100 grams and spinach has 2.9g of protein.
Does kale or spinach have more carbohydrates?
By weight, both kale and spinach are low in carbohydrates - kale has 4.4g of carbs for 100g and spinach has 3.6g of carbohydrates.
Does kale or spinach contain more calcium?
Both kale and spinach are high in calcium. Kale has 160% more calcium than spinach - kale has 254mg of calcium in 100 grams and spinach has 99mg of calcium.
Does kale or spinach contain more potassium?
Both kale and spinach are high in potassium. Spinach has 60% more potassium than kale - kale has 348mg of potassium in 100 grams and spinach has 558mg of potassium.