Grapes vs. Pineapple
Nutrition comparison of Grapes and Pineapple
Ever wonder how your favorite foods stack up against each other in terms of nutrition?
We compared the nutritional contents of
grapes
versus
pineapple
(100g each)
below using 2020 USDA and NIH data[1].
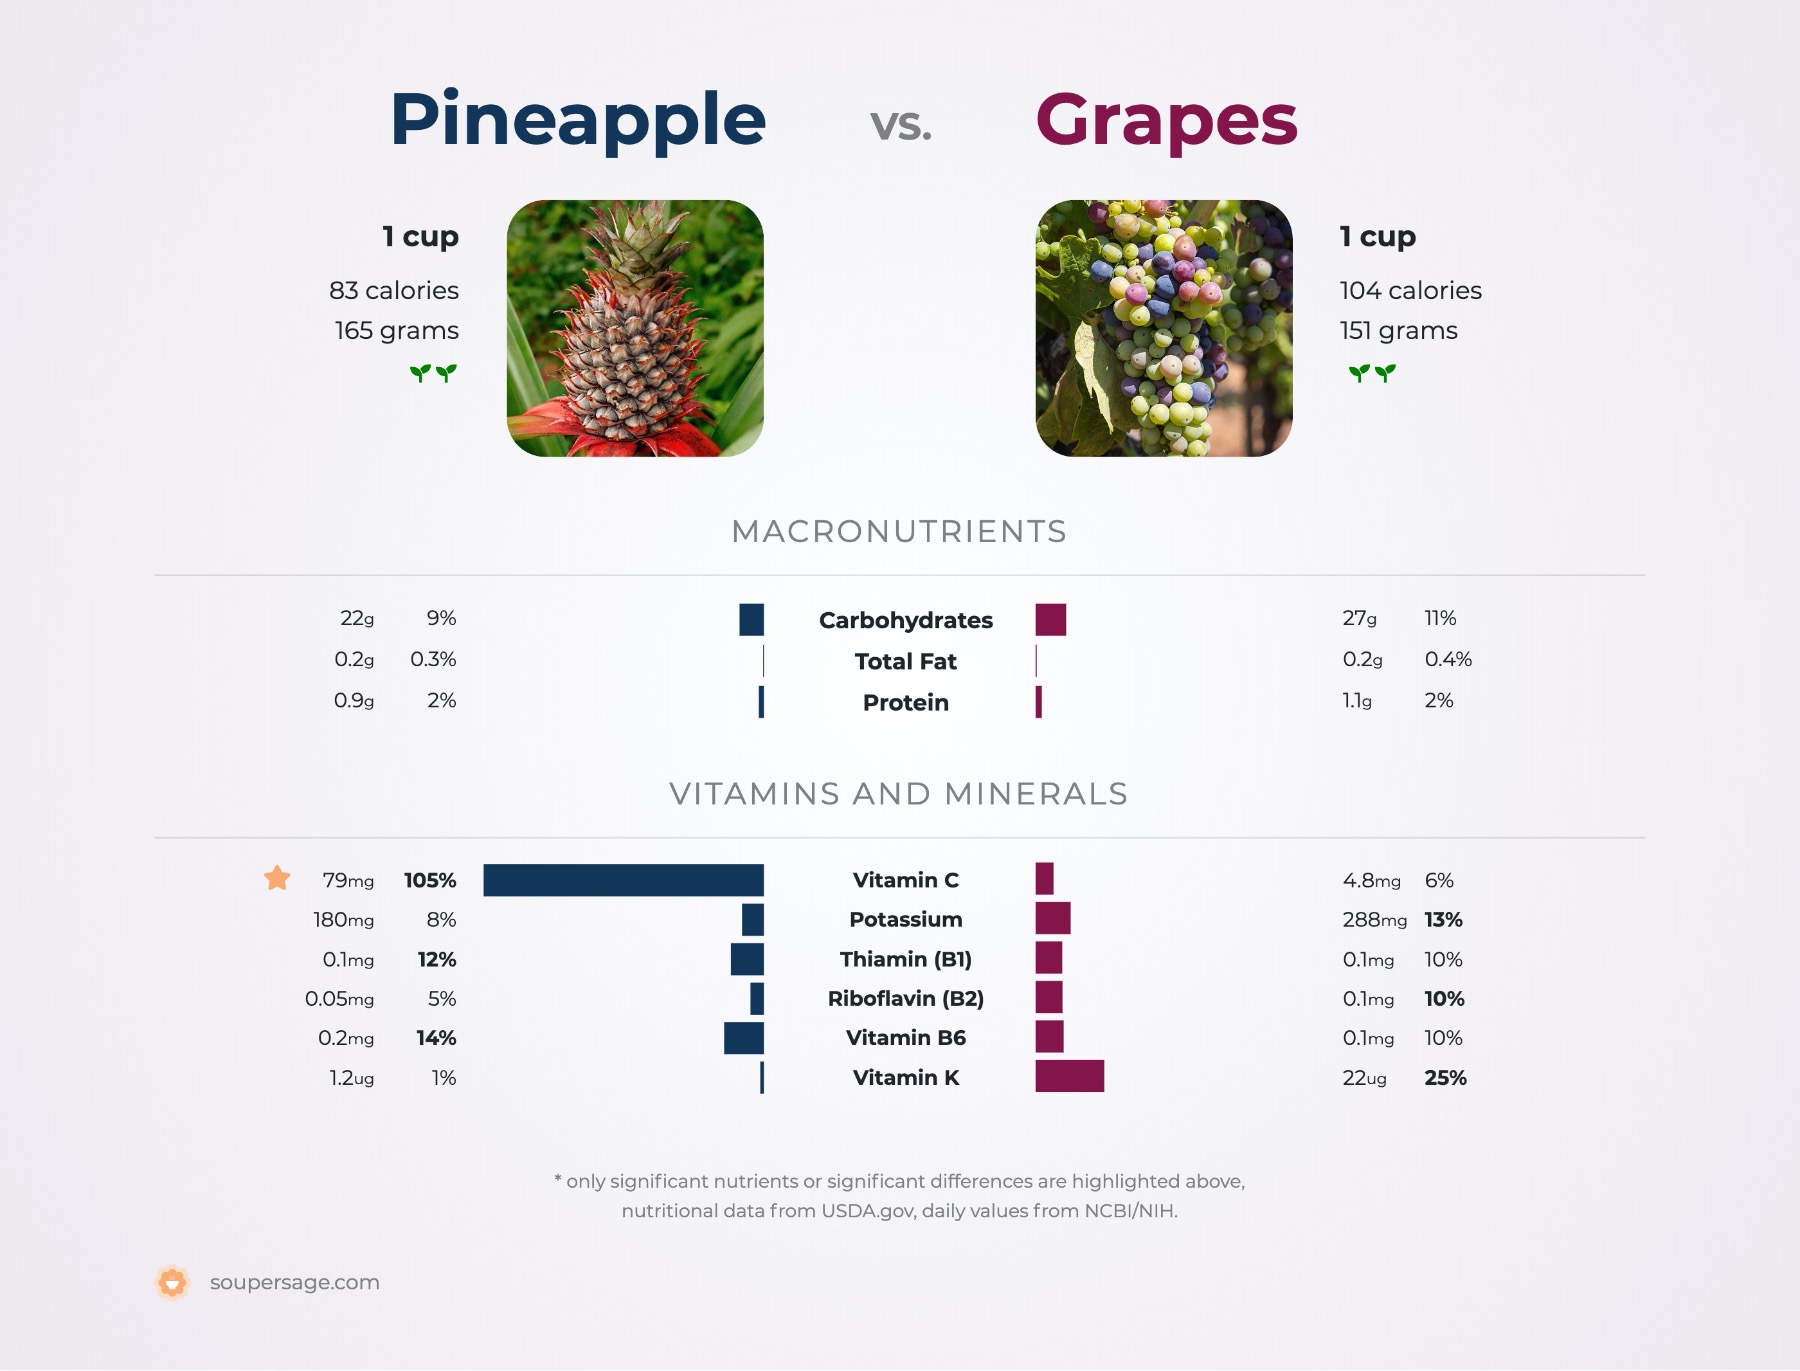
For a quick recap of significant nutrients and differences in grapes and pineapple:
- Pineapple has more niacin, pantothenic acid and folate.
- Pineapple is an excellent source of Vitamin C.
USDA sources for nutritional information: Grapes (Grapes, red or green (European type, such as Thompson seedless), raw) and Pineapple (Pineapple, raw, all varieties) . Have a correction or suggestions? Shoot us an email.
Calories and Carbs
calories
Pineapple and grapes contain similar amounts of calories - pineapple has 50 calories per 100 grams and grape has 69 calories.
For macronutrient ratios, grapes is similar to pineapple for protein, carbs and fat. Grapes has a macronutrient ratio of 4:95:2 and for pineapple, 4:94:2 for protein, carbohydrates and fat from calories.
Macro Ratios from Calories:
| Grapes | Pineapple | |
|---|---|---|
| Protein | 4% | 4% |
| Carbohydrates | 95% | 94% |
| Fat | 2% | 2% |
| Alcohol | ~ | ~ |
carbohydrates
Pineapple and grapes contain similar amounts of carbs - pineapple has 13.1g of total carbs per 100 grams and grape has 18.1g of carbohydrates.
dietary fiber
Pineapple has 56% more dietary fiber than grape - pineapple has 1.4g of dietary fiber per 100 grams and grape has 0.9g of dietary fiber.
sugar
Pineapple has 36% less sugar than grape - pineapple has 9.9g of sugar per 100 grams and grape has 15.5g of sugar.
Protein
protein
Pineapple and grapes contain similar amounts of protein - pineapple has 0.54g of protein per 100 grams and grape has 0.72g of protein.
Fat
saturated fat
Both pineapple and grapes are low in saturated fat - pineapple has 0.01g of saturated fat per 100 grams and grape has 0.05g of saturated fat.
Vitamins
Vitamin C
Pineapple is an excellent source of Vitamin C and it has 13 times more Vitamin C than grape - pineapple has 47.8mg of Vitamin C per 100 grams and grape has 3.2mg of Vitamin C.
Vitamin A
Pineapple and grapes contain similar amounts of Vitamin A - pineapple has 3ug of Vitamin A per 100 grams and grape has 3ug of Vitamin A.
Vitamin E
Pineapple and grapes contain similar amounts of Vitamin E - pineapple has 0.02mg of Vitamin E per 100 grams and grape has 0.19mg of Vitamin E.
Vitamin K
Pineapple and grapes contain similar amounts of Vitamin K - pineapple has 0.7ug of Vitamin K per 100 grams and grape has 14.6ug of Vitamin K.
The B Vitamins
Pineapple has more niacin, pantothenic acid and folate. Both grapes and pineapple contain significant amounts of thiamin, riboflavin and Vitamin B6.
| Grapes | Pineapple | |
|---|---|---|
| Thiamin | 0.069 MG | 0.079 MG |
| Riboflavin | 0.07 MG | 0.032 MG |
| Niacin | 0.188 MG | 0.5 MG |
| Pantothenic acid | 0.05 MG | 0.213 MG |
| Vitamin B6 | 0.086 MG | 0.112 MG |
| Folate | 2 UG | 18 UG |
Minerals
calcium
Pineapple and grapes contain similar amounts of calcium - pineapple has 13mg of calcium per 100 grams and grape has 10mg of calcium.
iron
Pineapple and grapes contain similar amounts of iron - pineapple has 0.29mg of iron per 100 grams and grape has 0.36mg of iron.
potassium
Grape has 75% more potassium than pineapple - pineapple has 109mg of potassium per 100 grams and grape has 191mg of potassium.
Antioxidants and Phytonutrients
carotenoids
Carotenoids are micronutrients commonly found in plants and some animal products. An example is beta-carotene, the notable carotenoid which is a popular source of Vitamin A.[4][5]
For specific types of carotenoids, both grapes and pineapple contain significant amounts of beta-carotene.
| Grapes | Pineapple | |
|---|---|---|
| beta-carotene | 39 UG | 35 UG |
| alpha-carotene | 1 UG | ~ |
| lutein + zeaxanthin | 72 UG | ~ |
Omega-3 and Omega-6
omega 3s
For omega-3 fatty acids, both grapes and pineapple contain significant amounts of alpha linoleic acid (ALA).
| Grapes | Pineapple | |
|---|---|---|
| alpha linoleic acid | 0.011 G | 0.017 G |
| Total | 0.011 G | 0.017 G |
omega 6s
Comparing omega-6 fatty acids, both grapes and pineapple contain small amounts of linoleic acid.
| Grapes | Pineapple | |
|---|---|---|
| linoleic acid | 0.037 G | 0.023 G |
| Total | 0.037 G | 0.023 G |
Customize your serving size
The comparison below is by common portions, e.g. cups, packages. You can also see a more concrete comparison by weight at equal weight (by grams) comparison.
Grapes g
()
|
Daily Values (%) |
Pineapple g
()
|
|||||
|---|---|---|---|---|---|---|---|
| KCAL % |
|
5% | calories | 5% |
|
KCAL % | |
| G % |
|
5% | carbohydrates | 5% |
|
G % | |
| G % |
|
5% | dietary fiber | 5% |
|
G % | |
| G | 5% | sugar | 5% | G | |||
| G % |
|
5% | total fat | 5% |
|
G % | |
| G % |
|
5% | saturated fat | 5% |
|
G % | |
| G | 5% | monounsaturated fat | 5% | G | |||
| G | 5% | polyunsaturated fat | 5% | G | |||
| G | 5% | trans fat | 5% | G | |||
| MG | 5% | cholesterol | 5% | MG | |||
| MG % |
|
5% | sodium | 5% |
|
MG % | |
| 5% | Vitamins and Minerals | 5% | |||||
| UG % |
|
5% | Vitamin A | 5% |
|
UG % | |
| MG % |
|
5% | Vitamin C | 5% |
|
MG % | |
| IU % |
|
5% | Vitamin D | 5% |
|
IU % | |
| MG % |
|
5% | calcium | 5% |
|
MG % | |
| MG % |
|
5% | iron | 5% |
|
MG % | |
| MG % |
|
5% | magnesium | 5% |
|
MG % | |
| MG % |
|
5% | potassium | 5% |
|
MG % | |
| MG % |
|
5% | thiamin (Vit B1) | 5% |
|
MG % | |
| MG % |
|
5% | riboflavin (Vit B2) | 5% |
|
MG % | |
| MG % |
|
5% | niacin (Vit B3) | 5% |
|
MG % | |
| MG % |
|
5% | Vitamin B6 | 5% |
|
MG % | |
| MG % |
|
5% | pantothenic acid (Vit B5) | 5% |
|
MG % | |
| UG % |
|
5% | folate (Vit B9) | 5% |
|
UG % | |
| UG % |
|
5% | Vitamin B12 | 5% |
|
UG % | |
| MG % |
|
5% | Vitamin E | 5% |
|
MG % | |
| UG % |
|
5% | Vitamin K | 5% |
|
UG % | |
| G % |
|
5% | protein | 5% |
|
G % | |
| UG % |
|
5% | biotin (Vit B7) | 5% |
|
UG % | |
| MG % |
|
5% | choline | 5% |
|
MG % | |
| MG % |
|
5% | chlorine | 5% |
|
MG % | |
| UG % |
|
5% | chromium | 5% |
|
UG % | |
| MG % |
|
5% | copper | 5% |
|
MG % | |
| UG % |
|
5% | fluoride | 5% |
|
UG % | |
| UG % |
|
5% | iodine | 5% |
|
UG % | |
| MG % |
|
5% | manganese | 5% |
|
MG % | |
| UG % |
|
5% | molybdenum | 5% |
|
UG % | |
| MG % |
|
5% | phosphorus | 5% |
|
MG % | |
| UG % |
|
5% | selenium | 5% |
|
UG % | |
| MG % |
|
5% | zinc | 5% |
|
MG % | |
| G | 5% | Water | 5% | G | |||
| G | 5% | Starch | 5% | G | |||
| G | 5% | Alcohol | 5% | G | |||
FAQ
Does pineapple or grapes contain more calories in 100 grams?Pineapple and grapes contain similar amounts of calories - pineapple has 50 calories in 100g and grape has 69 calories.
Does pineapple or grapes have more carbohydrates?
By weight, pineapple and grapes contain similar amounts of carbs - pineapple has 13.1g of carbs for 100g and grape has 18.1g of carbohydrates.