Butter, Unsalted vs. Peas
Nutrition comparison of Butter, Unsalted and Peas
Ever wonder how your favorite foods stack up against each other in terms of nutrition?
We compared the nutritional contents of
butter, unsalted
versus
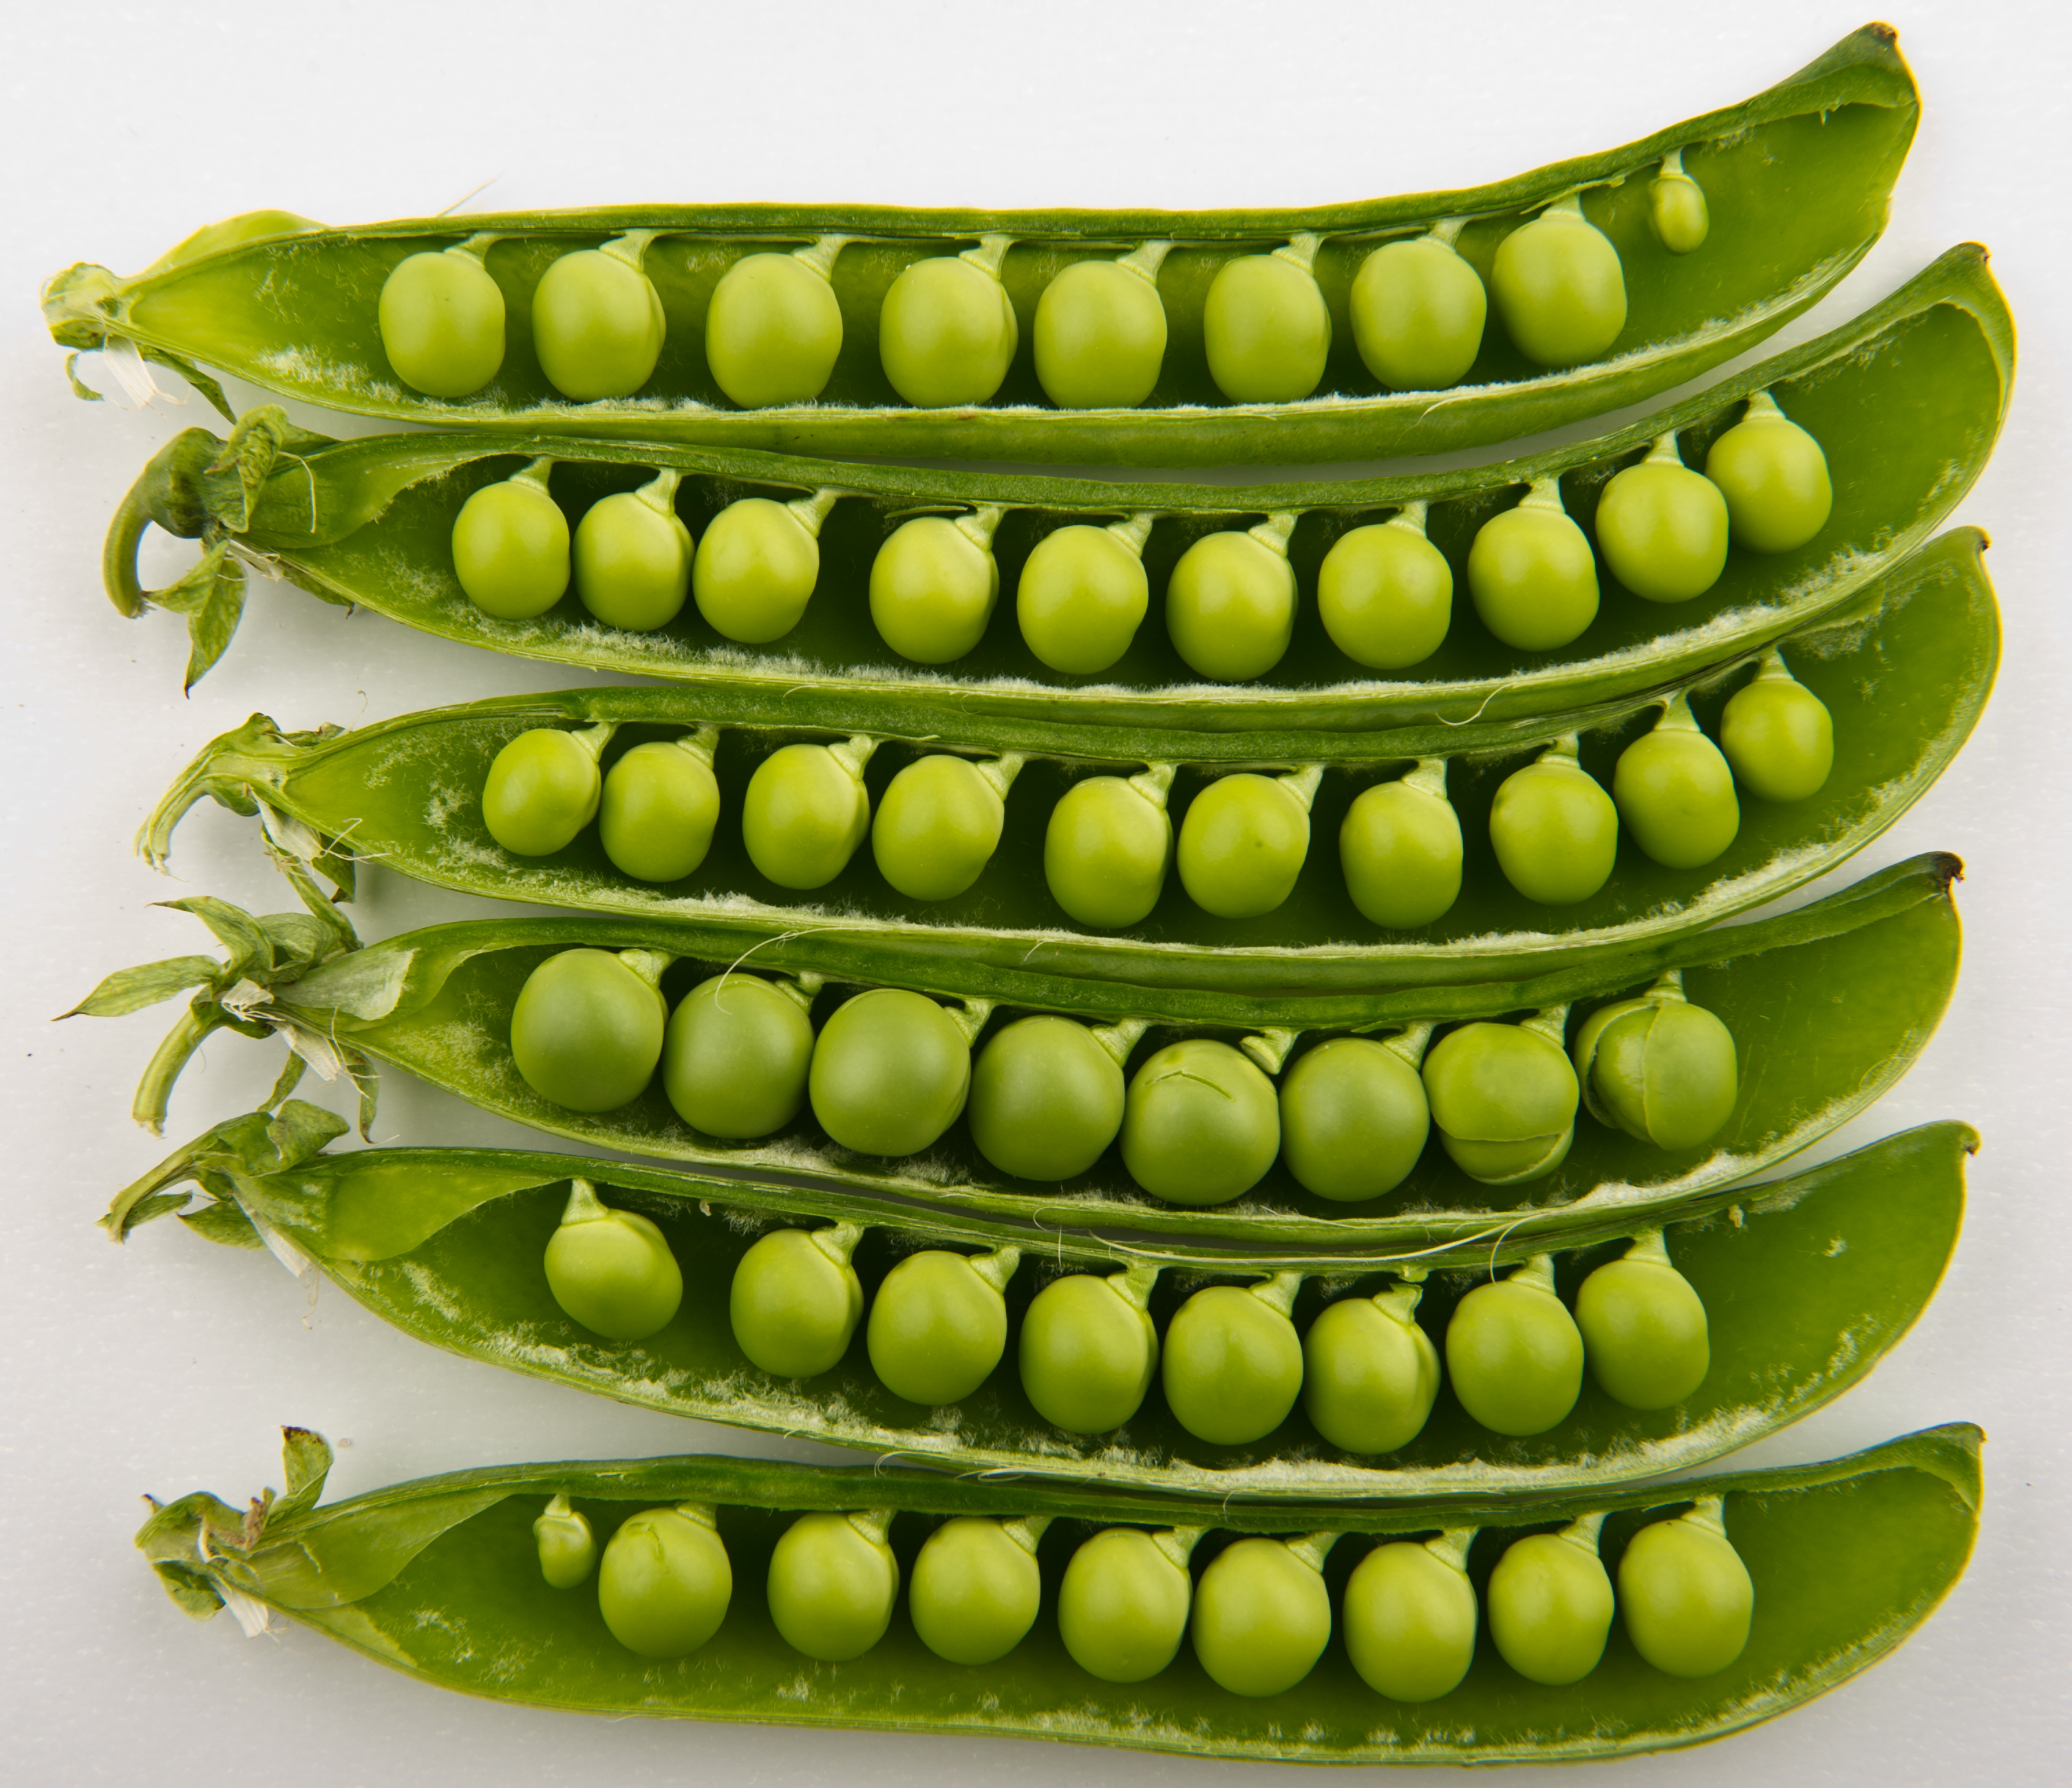
peas
(100g each)
below using 2020 USDA and NIH data[1].
For a quick recap of significant nutrients and differences in butter, unsalted and peas:
- Butter, unsalted has 239.8 times less carbohydrates than pea.
- Butter, unsalted has 93.5 times less sugar than pea.
- Butter, unsalted is an excellent source of Vitamin A.
- Pea has more thiamin, riboflavin, niacin, Vitamin B6 and folate, however, butter, unsalted contains more Vitamin B12.
- Pea has signficantly more iron than butter, unsalted.
- Pea is a great source of potassium.
- Pea is an excellent source of Vitamin C and dietary fiber.
USDA sources for nutritional information: Butter, Unsalted (Butter, without salt) and Peas (Peas, green, raw) . Have a correction or suggestions? Shoot us an email.

Calories and Carbs
calories
Butter, unsalted is high in calories and pea has 89% less calories than butter, unsalted - pea has 81 calories per 100 grams and butter, unsalted has 717 calories.
For macronutrient ratios, butter, unsalted is much lighter in protein, much lighter in carbs and much heavier in fat compared to peas per calorie. Butter, unsalted has a macronutrient ratio of 1:0:100 and for peas, 26:70:4 for protein, carbohydrates and fat from calories.
Macro Ratios from Calories:
| Butter, Unsalted | Peas | |
|---|---|---|
| Protein | 1% | 26% |
| Carbohydrates | ~ | 70% |
| Fat | 100% | 4% |
| Alcohol | ~ | ~ |
carbohydrates
Butter, unsalted has 239.8 times less carbohydrates than pea - pea has 14.5g of total carbs per 100 grams and butter, unsalted has 0.06g of carbohydrates.
dietary fiber
Pea is an excellent source of dietary fiber and it has more dietary fiber than butter, unsalted - pea has 5.7g of dietary fiber per 100 grams and butter, unsalted does not contain significant amounts.
sugar
Butter, unsalted has 93.5 times less sugar than pea - pea has 5.7g of sugar per 100 grams and butter, unsalted has 0.06g of sugar.
Protein
protein
Pea has 538% more protein than butter, unsalted - pea has 5.4g of protein per 100 grams and butter, unsalted has 0.85g of protein.
Fat
saturated fat
Butter, unsalted is high in saturated fat and pea has 100% less saturated fat than butter, unsalted - pea has 0.07g of saturated fat per 100 grams and butter, unsalted has 50.5g of saturated fat.
cholesterol
Butter, unsalted is high in cholesterol and pea has less cholesterol than butter, unsalted - butter, unsalted has 215mg of cholesterol per 100 grams and pea does not contain significant amounts.
Vitamins
Vitamin C
Pea is an excellent source of Vitamin C and it has more Vitamin C than butter, unsalted - pea has 40mg of Vitamin C per 100 grams and butter, unsalted does not contain significant amounts.
Vitamin A
Butter, unsalted is an excellent source of Vitamin A and it has 17 times more Vitamin A than pea - pea has 38ug of Vitamin A per 100 grams and butter, unsalted has 684ug of Vitamin A.
Vitamin E
Butter, unsalted has 16 times more Vitamin E than pea - pea has 0.13mg of Vitamin E per 100 grams and butter, unsalted has 2.3mg of Vitamin E.
Vitamin K
Peas and butter, unsalted contain similar amounts of Vitamin K - pea has 24.8ug of Vitamin K per 100 grams and butter, unsalted has 7ug of Vitamin K.
The B Vitamins
Pea has more thiamin, riboflavin, niacin, Vitamin B6 and folate, however, butter, unsalted contains more Vitamin B12. Both butter, unsalted and peas contain significant amounts of pantothenic acid.
| Butter, Unsalted | Peas | |
|---|---|---|
| Thiamin | 0.005 MG | 0.266 MG |
| Riboflavin | 0.034 MG | 0.132 MG |
| Niacin | 0.042 MG | 2.09 MG |
| Pantothenic acid | 0.11 MG | 0.104 MG |
| Vitamin B6 | 0.003 MG | 0.169 MG |
| Folate | 3 UG | 65 UG |
| Vitamin B12 | 0.17 UG | ~ |
Minerals
calcium
Peas and butter, unsalted contain similar amounts of calcium - pea has 25mg of calcium per 100 grams and butter, unsalted has 24mg of calcium.
iron
Pea has signficantly more iron than butter, unsalted - pea has 1.5mg of iron per 100 grams and butter, unsalted has 0.02mg of iron.
potassium
Pea is a great source of potassium and it has 917% more potassium than butter, unsalted - pea has 244mg of potassium per 100 grams and butter, unsalted has 24mg of potassium.
Antioxidants and Phytonutrients
carotenoids
Carotenoids are micronutrients commonly found in plants and some animal products. An example is beta-carotene, the notable carotenoid which is a popular source of Vitamin A.[4][5]
For specific types of carotenoids,
| Butter, Unsalted | Peas | |
|---|---|---|
| beta-carotene | 158 UG | 449 UG |
| alpha-carotene | ~ | 21 UG |
| lutein + zeaxanthin | ~ | 2477 UG |
Omega-3 and Omega-6
omega 3s
For omega-3 fatty acids, butter, unsalted has more alpha linoleic acid (ALA) than pea per 100 grams.
| Butter, Unsalted | Peas | |
|---|---|---|
| alpha linoleic acid | 1.18 G | 0.035 G |
| Total | 1.18 G | 0.035 G |
omega 6s
Comparing omega-6 fatty acids, butter, unsalted has more linoleic acid than pea per 100 grams.
| Butter, Unsalted | Peas | |
|---|---|---|
| other omega 6 | 0.138 G | ~ |
| linoleic acid | 1.83 G | 0.152 G |
| Total | 1.968 G | 0.152 G |
Customize your serving size
The comparison below is by weight, but sometimes 100g isn't that intuitive of a measurement for food. View a custom portion comparison (e.g. cups, oz, package).
You can try adding or subtracting the amount of either Butter, Unsalted or Peas .
Note: The specific food items compared are: Butter, Unsalted (Butter, without salt) and Peas (Peas, green, raw) .
Butter, Unsalted g
()
|
Daily Values (%) |
Peas g
()
|
|||||
|---|---|---|---|---|---|---|---|
| KCAL % |
|
5% | calories | 5% |
|
KCAL % | |
| G % |
|
5% | carbohydrates | 5% |
|
G % | |
| G % |
|
5% | dietary fiber | 5% |
|
G % | |
| G | 5% | sugar | 5% | G | |||
| G % |
|
5% | total fat | 5% |
|
G % | |
| G % |
|
5% | saturated fat | 5% |
|
G % | |
| G | 5% | monounsaturated fat | 5% | G | |||
| G | 5% | polyunsaturated fat | 5% | G | |||
| G | 5% | trans fat | 5% | G | |||
| MG | 5% | cholesterol | 5% | MG | |||
| MG % |
|
5% | sodium | 5% |
|
MG % | |
| 5% | Vitamins and Minerals | 5% | |||||
| UG % |
|
5% | Vitamin A | 5% |
|
UG % | |
| MG % |
|
5% | Vitamin C | 5% |
|
MG % | |
| IU % |
|
5% | Vitamin D | 5% |
|
IU % | |
| MG % |
|
5% | calcium | 5% |
|
MG % | |
| MG % |
|
5% | iron | 5% |
|
MG % | |
| MG % |
|
5% | magnesium | 5% |
|
MG % | |
| MG % |
|
5% | potassium | 5% |
|
MG % | |
| MG % |
|
5% | thiamin (Vit B1) | 5% |
|
MG % | |
| MG % |
|
5% | riboflavin (Vit B2) | 5% |
|
MG % | |
| MG % |
|
5% | niacin (Vit B3) | 5% |
|
MG % | |
| MG % |
|
5% | Vitamin B6 | 5% |
|
MG % | |
| MG % |
|
5% | pantothenic acid (Vit B5) | 5% |
|
MG % | |
| UG % |
|
5% | folate (Vit B9) | 5% |
|
UG % | |
| UG % |
|
5% | Vitamin B12 | 5% |
|
UG % | |
| MG % |
|
5% | Vitamin E | 5% |
|
MG % | |
| UG % |
|
5% | Vitamin K | 5% |
|
UG % | |
| G % |
|
5% | protein | 5% |
|
G % | |
| UG % |
|
5% | biotin (Vit B7) | 5% |
|
UG % | |
| MG % |
|
5% | choline | 5% |
|
MG % | |
| MG % |
|
5% | chlorine | 5% |
|
MG % | |
| UG % |
|
5% | chromium | 5% |
|
UG % | |
| MG % |
|
5% | copper | 5% |
|
MG % | |
| UG % |
|
5% | fluoride | 5% |
|
UG % | |
| UG % |
|
5% | iodine | 5% |
|
UG % | |
| MG % |
|
5% | manganese | 5% |
|
MG % | |
| UG % |
|
5% | molybdenum | 5% |
|
UG % | |
| MG % |
|
5% | phosphorus | 5% |
|
MG % | |
| UG % |
|
5% | selenium | 5% |
|
UG % | |
| MG % |
|
5% | zinc | 5% |
|
MG % | |
| G | 5% | Water | 5% | G | |||
| G | 5% | Starch | 5% | G | |||
| G | 5% | Alcohol | 5% | G | |||
FAQ
Does peas or butter, unsalted contain more calories in 100 grams?Butter, unsalted is high in calories and pea has 90% less calories than butter, unsalted - pea has 81 calories in 100g and butter, unsalted has 717 calories.
Does peas or butter, unsalted have more carbohydrates?
By weight, butter, unsalted has 239.8 times fewer carbohydrates than pea - pea has 14.5g of carbs for 100g and butter, unsalted has 0.06g of carbohydrates.